Chapter 3: Systems Mapping
Tai Munro
Key Ideas
In this chapter, you will learn about:
- the value of systems maps
- how to construct a systems map
A systems map is a way to visualize systems. They are essential to understanding systems because, as Capra and Luisi (2014) argue, relationships, which are fundamental to systems, cannot be understood through measurement; they have to be understood through mapping. You have probably seen systems maps before without calling them that. For example, the water cycle that many of us learned about in school is a map of a system, the water system (more complex versions of this map that also include human use and influence are also available, such as this one by Water Science School with the USGS: The Water Cycle). Mapping systems helps us to visualize the system and all of its parts. It also helps us to develop a common understanding of the system we are talking about and identify patterns within the system (Capra & Luisi, 2014).
We are going to use two different types of maps: cluster mapping and causal loop mapping. Together, these two types of maps will help you explore the system, identify relationships, and determine causality.
Cluster Mapping
A cluster map is a first step at mapping a system. The general steps are:
- identify an issue that you want to explore
- brainstorm everything that you can think of that relates to that issue
- draw connections between the different items as you identify relationships and interconnections
Let’s work through an example together to help clarify this.
Warning: This will be messy.
Step 1
Identify an issue that we want to explore. We are going to start simple and look at the temperature in a home.
Note: The best way to learn systems mapping is to do it, so follow along and write the issue in the centre of a piece of paper.
Step 2
Brainstorm everything that you can think of that relates to that issue. Complete your own brainstorming first and then compare yours to the example. Don’t expect them to be exactly the same. Remember, different people bring different perspectives and experiences.
Step 3
Now start to connect the different nodes in your cluster map. The majority of what you identified will probably be elements. You will put a circle around these as you make connections between elements. To draw the relationships or interconnections, draw a circle around each element and connect the elements with an arrow. The arrows should be single-headed, i.e., they point in one direction. If there is also a reciprocal relationship, draw a second arrow pointing in the other direction. Label the arrows with a description of the relationship. An important note is that the interconnection label should not be the consequence but should focus on how they interact with each other. For example, the thermostat “adjusts” the furnace.
As you do this process, you may find that you identify some elements that you missed in your initial brainstorming. This is to be expected. Add them in as they occur to you.
Step 4
This step is about starting to look for insights in your map. Some of the questions you may want to ask include:
- Are there key elements or connections that impact lots of the map?
- What are the key insights that you gained from the activity? An example of an insight is a key element or interconnection that wasn’t obvious initially.
- What potential low-impact or high-impact leverage points can you see?
- Where is there feedback in the system?
- What biases are present, or do you think might be present, in your map? How do you know?
Now that you have a cluster map, you can use it to identify areas of a system that you want to look deeper at. One tool you can use to do this is causal or feedback loop mapping.
Causal (Feedback) Loop Mapping
Remember that identifying circular causality is one of the biggest challenges in systems thinking because it is so different from how we are taught for most of our lives. We already worked on this a little bit in chapter 2, so if you need to go back and review the material, do that first.
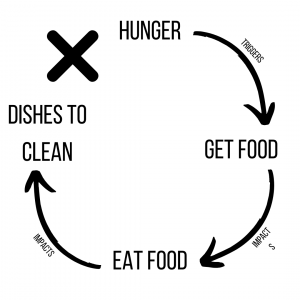
Let’s start with a simple causal loop: managing your hunger level at home. Watch the video (3:24) to see how we build a causal loop map.
Note: The following video is a whiteboard-animated video. The illustrations used depict what is being described in the narration. You do not need to see the illustrations to understand the video.
See if you can describe the steps that we took to build this simple causal loop map before comparing your steps to the ones we have identified.
Steps for Drawing Causal Loop Diagrams
- Identify elements that have a causal relationship. We recommend starting with two elements but they can have more or less. Make sure that A causes a change in B and B causes a change in A. How you name the elements in a causal loop is important. You should consider:
- Can the element change? For example, a fridge can’t change, but the amount of food in the fridge can. Therefore, best practice is to write down “amount of food in fridge” as the element.
- Is the element neutral? Keeping the elements neutral allows the diagram to show how it might change in either direction. For example, from the example in the video we use hunger as the element rather than more or less hungry.
- Draw the arrows in the direction of causality. Important points to consider at this step include:
- The arrows should all point in either a clockwise or counterclockwise direction. There should never be two arrows pointing to the same element
 within a causal loop. This would break the chain of causality.
- Each element must cause a change in the next one. For example, being hungry makes you go get food. Getting food allows you to eat the food. Ea
ting the food changes how hungry you are. A common pitfall at this point is pointing to another element that is connected but not causally related. For example, eating food might cause a change in the number of dishes you have to wash, but the number of dishes you have to wash will not cause a change in how hungry you are.
- Track the direction of change for each relationship. This is when we determine if the relationship should be labelled with an s or an o to indicate the direction of change relative to the previous item in the loop. One strategy to help figure this out is to use small temporary arrows on each item. This approach is demonstrated in the next video (1:13). Please note that this is a visual strategy.
- Determine if the loop is reinforcing or balancing. The loop will be reinforcing if:
- there are no “o’s” in the loop
- there is an even number of “o’s” in the loop
Otherwise, the loop is a balancing feedback loop.
Of course, many of these causal loops don’t happen in isolation; so loops can be connected to other loops. Let’s look at an example in the next video (2:07).
Note: The following video is a whiteboard-animated video. The illustrations used depict what is being described in the narration. You do not need to see the illustrations to understand the video.
Check whether the loops are reinforcing or balancing:
Predicting the Impacts of Leverage Points
Recall from the previous chapter that feedback loops are a good place to look for leverage points. Once you have created your causal loop diagram, you can use it to examine the impacts of a potential leverage point. It is helpful here to talk through the impacts of a change to some aspect of the feedback loop on the loop as a whole. For example, in the interconnected loops from the previous video, we might consider how a change in the availability of groceries at the store, due to significant price increases or perhaps a supply chain breakdown, would affect our ability to put food in the fridge. This could have cascading impacts through all of the loops affecting how much you can eat and how hungry you are. The supply chain breakdown would weaken the feedback loop between the amount of food in the fridge and the amount of groceries you buy. It would likely increase the delay in your response because you would have to wait longer to get the food you need.
Telling the Story of the System
The maps are part of telling the story of the system, but they are influenced by our own perceptions and biases, especially when we are building them by ourselves. This is why looking at the story the map tells is important once you think you are done. Does the story match the map? Are there hidden plot twists you didn’t know existed in the story? Are there biases in the story that need to be overcome?
Recommended Resources
Check out Systems Mapping by Leyla Acaroglu (2017). The first type of map described in this post is the cluster map. Acaroglu also goes over a third type of map called connected circles mapping. The site has some helpful tips on how to construct the systems map that will be useful as you start to develop your own maps.
Another helpful resource is Causal Loop Construction: The Basics by Colleen Lannon.
Let’s Get a Little More Complex
Next, see if you can follow the steps you just learned to map a more complex system. We recommend looking at an organization like a college, university, or another organization you are familiar with. Because we are mapping a different system from you, our maps will be different. But once you are done, look at our map of an undergraduate university and see if you can see some common patterns.
To take this a step further and help show our reasoning, we can also explain the interconnections more fully. We have done this with the explanation between faculty, students, and the community.
Although there may be other connections between these three elements in theory, faculty and students interact through teaching and learning. They bring the community in through projects and placements. Faculty or students may engage in research projects that involve or study the community, and many students participate in placements within the community through specific programs or courses. In turn, these interconnections may contribute to teaching and learning.
Next, we need to identify feedback or causal loops. Here are two examples:
There is (hopefully) a feedback loop between faculty and students. Faculty use teaching methods to help students. The students then complete assessments. The faculty grade the assessments. Based on the grades, faculty will change or maintain their teaching methods. Watch the video (2:23) for a discussion of this causal loop.
Note: The following video is a whiteboard-animated video. The illustrations used depict what is being described in the narration. You do not need to see the illustrations to understand the video.
Another feedback loop would be between students and funding. If tuition increases too much, then fewer students will attend the university, and the university will have to raise funds through different means, such as higher tuition or grants and donations. If tuition becomes very low, there might be more students than the university can accommodate, which would potentially result in restrictions such as program caps and competitive admission. Watch the next video (2:27) to review this loop.
Note: The following video is a whiteboard-animated video. The illustrations used depict what is being described in the narration. You do not need to see the illustrations to understand the video.
Leverage points
A leverage point in the system is government funding. If the government reduces funding, it has many repercussions throughout the system, including a reduced number of classes, increased class size, fewer staff and resources, higher tuition, etc.
Emergent properties
Remember, one of the main characteristics of systems is that they have emergent properties. These are properties that emerge from the system due to the relationships rather than from any one item. What emergent properties can you think of for the organization that you mapped?
Some of the emergent properties that appear in the system of the undergraduate institution may include:
- prioritizing money and funding over the quality of learning experiences
- professors prioritizing activities other than teaching depending on how they are evaluated
Add One More Level
Watch the video Systems thinking: A cautionary tale (cats in Borneo) by Sustainability Illustrated for the final practice map. This is an excellent example because it describes a number of feedback loops and identifies different leverage points, although the video doesn’t use that language, so you will need to interpret it. Based on the video, try to:
- draw a cluster map of the system
- draw a minimum of two causal loop diagrams, including the direction of change and whether they are balancing or reinforcing
- identify two leverage points
- identify one emergent property
Check your cluster map in the following interaction. Remember, they probably won’t be identical. Look for similarities and differences between your map and the sample to help you identify areas where you might need clarification.
Feedback loops
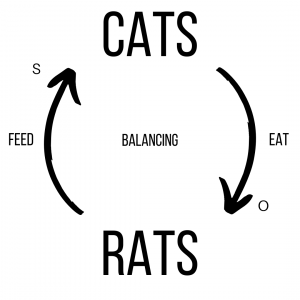
The cats eating the rats is normally a balancing feedback loop because the cats keep the rat population around a certain number.
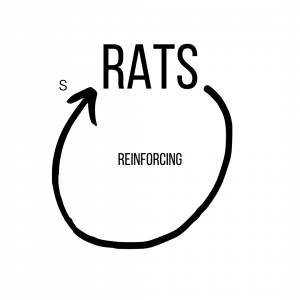
But when the cats died, the rats became part of a reinforcing loop because more rats led to even more rats.
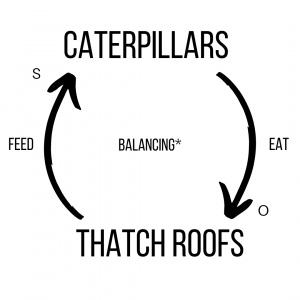
The caterpillars and the thatch roofs without the presence of wasps is a balancing feedback loop because as the caterpillars eat the thatch roofs, less thatch will be available, which will reduce the food available for the caterpillars. However, within a shorter timeline, when the caterpillars have not yet eaten enough thatch to reduce their food supply, this loop would appear to be reinforcing because as the caterpillars ate thatch and weren’t killed by the wasps, they were able to breed more and therefore eat more thatch.
There is one concept that is relevant here that we haven’t talked about yet. It is beyond the scope of this textbook except for a brief mention. Delays are another fundamental part of a system; paying attention to delays is part of systems thinking. The caterpillars and the rats without the presence of their predators, appear to be reinforcing. However, this is because we are looking within a short time frame. Ultimately, the rats would run out of shelter and fewer would survive, although there would be more than there were in the presence of cats. And the caterpillars would eventually eat all the thatch and start to die off. Delays make the causal loops harder to identify accurately because we can miss the impacts. This is an important concept if you are going to continue your systems thinking journey.
Leverage point
The cats and the DDT are both leverage points in this system. The cats have a significant impact because they control the rats, which improves the Dayak people’s health and the availability of food. DDT is also a leverage point because it affects many parts of the system — mosquitoes, cats, and wasps — which in turn affects many other parts of the system. The use of DDT in this example shows that leverage points are not always positive.
Emergent property
A main emergent property of this system is the poor health of the Dayak people.
Activity 3.1: Systems Mapping
Now that you have practiced building a systems map, see if you can build a map about a familiar topic. You may choose something like the system that affects your mental health and well-being, the education system where you live, or the system found in an organization. Another option is to watch a video describing a system and see if you can map it. George Monbiot hosts a good series of videos to use for this purpose on the Sustainable Human YouTube Channel. Some options are:
References
Acaroglu, L. (2017, November 3). Tools for Systems Thinkers: Systems Mapping. Disruptive Design. https://medium.com/disruptive-design/tools-for-systems-thinkers-systems-mapping-2db5cf30ab3a
Sustainability Illustrated. (2014, May 6). Systems thinking: A cautionary tale (cats in Borneo) [Video]. YouTube. https://www.youtube.com/watch?v=17BP9n6g1F0
"A bias is a tendency, inclination, or prejudice toward or against something or someone" (Psychology Today, no date).
Bias, n. (2023). In Psychology Today. Psychology Today. https://www.psychologytoday.com/ca/basics/bias
