Chapter 12: Writing Research Proposals and Reports
Research is of no use unless it gets to the people who need to use it.
— Chris Whitty [1]
Learning Objectives
After reading this chapter, students should be able to do the following:
- Outline the main components of a research proposal.
- Explain the purpose of a method section in a research proposal.
- Identify key ethical considerations that need to be addressed in a research proposal.
- Outline the structure and format of a scholarly research report.
INTRODUCTION
Just as research is conducted for a variety of purposes, such as to explore or to explain a phenomenon of interest, as discussed at the start of this book, research is also carried out with its eventual target audience in mind, as implied by the opening quote. Basic research is generally undertaken for an academic audience, and research findings are disseminated (communicated) in reports that form the basis of conference talks or published works such as books, chapters, or journal articles read by scholars in affiliated disciplines. Disciplines recommend their own writing style for academic papers and reports. Three common documentation styles used in the social sciences throughout North America are American Psychological Association (APA) style, American Sociological Association (ASA) style, and Modern Language Association (MLA) style. All three provide direction for quoting and paraphrasing the work of others, for setting up the format of documents (e.g., spacing, headers, and the presentation of material in tables and figures), and for referencing sources. APA format is based on the most current edition of the Publication Manual of the American Psychological Association. MLA style is based on the most current edition of the MLA Handbook for Writers of Research Papers, and ASA is based on the American Sociological Association Style Guide. Consult with your instructor, your course syllabus, your library’s writing resources, or the instructions for contributors at a journal to determine the exact style you should use for preparing course work, research proposals, or research reports.
Research Proposals versus Reports
Most everyone who takes a research methods course or who plans to carry out basic research for an honours project, an independent study, or graduate studies (e.g., master’s research or a research-based dissertation for a doctorate degree) is expected to develop a research proposal. Similarly, researchers and other academics who wish to carry out studies at universities, in community settings, and in the private or business sector typically submit a research proposal to an ethics board and/or to a funding agency prior to beginning the research project. A research proposal is a comprehensive plan, created in advance of carrying out research, that details what a research project is about and what the process entails for obtaining the data needed to address the research questions and objectives. Included in the proposal is a description of the relevant literature, the main research questions or hypotheses the study hopes to address, the methods for obtaining data, and anticipated ethical considerations. A research report, in contrast, is written after research is conducted. The report is a detailed account that describes the area of interest, provides the specific research questions or hypotheses addressed in the study, spells out the methods used to obtain the data, and communicates the main results from the study. In addition, a research report discusses the findings in relation to the wider literature on the subject matter, indicates any limitations of the study, and offers suggestions for future research on that topic. The next section provides you with some guidance for what to include in a research proposal.

The Research Proposal
A research proposal is meant to address two primary questions: (1) What purpose does the research serve? and (2) How will the research be carried out to meet the intended objective? The research purpose is articulated in the introduction section and the planned process for carrying out the research is detailed in the method section. A research proposal is usually divided into five main sections consisting of an introduction, a method section, a section on data analysis and dissemination, a section on ethical considerations, and a listing of prospective references. These sections are described in detail below.
Introduction
To explain the research purpose in a manner that is accessible to a wide audience of readers, a researcher should frame the general research interest within a theoretical context, briefly describe what other researchers have done and found on the topic, state the current research interest, and explain how the present study will contribute to the literature by posing specific research questions and/or by testing hypotheses. Begin with a broad opening statement that identifies the area of interest. For example, a student of mine who planned to compare the portrayal of masculinity in the lyrics of country versus hip-hop songs began by pointing out the increasing popularity of both genres of music and went on to point out the earnings and prevalence of the two genres in order to introduce the general topic (Holub, 2012). After introducing the general topic, a researcher can begin to narrow the topic by linking the topic to previous research on the proposed area of interest. This is where central concepts are discussed and the theoretical context is established. Continuing with the previous example, my student went on to point out prevalent masculinity themes identified in previous research on lyrics of music from the two genres. The same student ended the introduction by noting that the proposed study would compare depictions of masculinity across genres to see if there were common underlying features. A qualitative study with an exploratory focus is going to include a general question, such as “Are there similarities in the way masculinity is depicted in country and hip-hop music lyrics?” In contrast, a quantitative study with a more descriptive focus would likely include a directional hypothesis, such as “H1: The proposed study predicts that masculinity will be more evident in hip-hop than in country music lyrics.” Ask yourself the following questions as you prepare the introductory section:
- What is my broad area of interest?
- Did I identify a narrow focus within this area of interest?
- Did I summarize the relevant literature in this area?
- Did I include clear conceptual definitions for the main concepts?
- Is a theoretical context established for my study?
- What will my research contribute to this area?
- What is my research question or hypothesis?
Method
The method section outlines who the participants will be and how they will be selected. In addition, the method section includes details about the setting and materials needed to conduct the study, the procedures for carrying out the study, and the main variables examined in the study, as discussed in more detail below.
Participants and How They Will be Obtained or Sample Selection
First, if the study will include research participants, such as interview participants, survey respondents, or experimental subjects, a researcher needs to detail who the potential research participants will be and how they will be identified and recruited. In addition, the researcher should note any relevant criteria that may be used to include or exclude participants. For example, an honours student working under one of the author’s supervision examined the prevalence of aggressive and dangerous forms of driving in a sample of 300 university students (Haje & Symbaluk, 2014). In an ethics application, Bruno Haje proposed that participants would be recruited from the university’s research subject pool in accordance with the department’s procedures for online survey research participation. Bruno also pointed out that since this study was specifically about driving behaviours, participants would need to be volunteers who drive a motor vehicle at least on occasion.
Note that not all forms of research involve research participants. A researcher planning to use unobtrusive methods, such as physical trace analysis, or wanting to carry out a content analysis would instead describe proposed units of analysis. Recall Gackenbach et al.’s (2011) study on the video game player’s online dream diary. Although there was a person to whom the dreams belonged, it was the content of 447 of his 831 dream postings that constituted the units of analysis. In a qualitative study, this section is usually titled sample selection. Here, a researcher articulates how the sample (e.g., of dream postings) will be obtained, including any inclusion or exclusion criteria that will determine eligibility (Padgett, 2012). For example, of the 831 posted dreams, a dream was included in the analysis if it was more than 50 but fewer than 500 words, had a clear date as to when it occurred, included an activity blog entry from the night before the dream, and fit one of the defined dream categories, resulting in a sample of 447 dreams (Gackenbach et al., 2011).

Setting and Materials
In addition to describing the participants and how they will be recruited or the units of analysis, the method section also indicates the proposed setting or location for data collection and any materials needed to carry out the study. Research is often carried out at a university where the primary researcher holds a faculty position. However, if the study is an in-depth qualitative interview, the setting may be the respondent’s place of residence or a public location that the respondent feels comfortable in and one that provides some degree of needed privacy, such as a booth in a local coffee shop. Similarly, if the study involves ethnographic fieldwork, the research setting is likely to be wherever that group or process is located and can best be examined from within a natural context.
Materials for a study include items that need to be purchased ahead of time to carry out the study. For example, to carry out my master’s research on pain perception and endurance, I needed to purchase a heart rate monitor to assess participants, for health and safety reasons, throughout the exercise. I also needed equipment that could be used to assist in the measurement of pain endurance. Specifically, participants performed an isometric sitting exercise above a box with a pressure plate. A participant who was too tired to continue sat down on the box, thereby activating the pressure plate to stop a timer that recorded endurance.
As another example, an online ethnography might require a computer, internet access, and possibly some kind of registration or software needed to gain access to a group of interest, such as through a membership or user account. Finally, a researcher conducting an interview-based study might wish to use incentives to compensate interviewees for their time and would therefore need to purchase gift cards or prepare some comparable remuneration in advance of the study.
Main Variables
Next, researchers describe the main variables or measures of interest. If the approach is quantitative, as in the case of an experimental method, this section describes the dependent variables. (The independent variables are discussed as part of the procedures for how the manipulation will be carried out.) For example, in the pain study, the main dependent variable was pain endurance, defined as the length of a time a participant was able to maintain an isometric sitting exercise in minutes and seconds. Each dependent variable should be listed, along with the operational definition for how it will be measured. For a quantitative survey, each main variable is likely to be measured using a question or multiple questions on a self-report questionnaire. For example, in a study on aggressive driving, aggressive behaviour might be measured using Deffenbacher et al.’s (2002) shortened version of the Driver Anger Expression Inventory, consisting of 21 items. The inventory assesses verbally aggressive behaviour (e.g., yelling at other drivers), physically aggressive behaviour (e.g., giving someone the finger), and/or constructive expressions of anger (e.g., thinking about other things). Survey items are usually summarized in this section and the full inventory is included in an appendix. If the measures are already established, you can report on the reliability and validity of the measure as described in the literature.
Alternatively, if a study is based on a qualitative content analysis, an in-depth interview, or an unstructured observation, this section elaborates on how the researcher plans to identify main themes and patterns from the data once it is collected and transcribed, as opposed to operationalizing variables ahead of time. This section is sometimes called coding procedures and it can take the place of the main variables and procedures sections. For example, a researcher who wishes to examine a television series for depictions of violence enacted by the main characters might indicate a plan to use an open coding scheme to detail every separate and distinct act of violence committed by a main character as a first-cycle coding method. This can be followed by second phase of coding directed at identifying main themes and categorizing the patterns to the violence identified in the first round of coding. Similarly, an ethnographer might plan to use descriptive coding for field notes and documents collected on a group of interest that will be later subjected to a more structured coding process. A qualitative researcher might also adopt existing coding schemes from the established literature to conduct a content analysis. When possible, the researcher should articulate the coding schemes and tie them back to the theoretical context in which they developed. Since the content of any method section is going to vary considerably depending on the approach and methodology (e.g., quantitative survey versus qualitative interview), you should examine published journal articles based on the same methodology you plan to use for a more definitive sense of what you need to include here.

Procedures
Finally, the procedures section outlines the detailed plan for carrying out the study as the last main component of the method section. This section needs to include enough detail that a reader could replicate the study exactly, based on how it is described in writing. For example, if a researcher intends to conduct online survey research, the procedures will detail how the participants are to access the online survey through a link they receive in an email invitation sent to their university email account. Once a participant clicks on the study link, what happens next? The procedures walk the reader through the study. For an online survey, the first page that is likely to appear on the screen following the link to the study is the informed consent statement. The procedures will then go into detail about how the online consent form describes the study, provides details about what is expected of participants, notes the benefits and risk of participation, indicates that participation is voluntary, and explains how privacy will be maintained and what the plans are for dissemination of findings. The procedures also indicate how consent is obtained. In the case of an online survey, potential participants are likely to be asked to click on a box that reads something like “I agree to participate in this study” or “I do not agree to participate in this study.” Procedures can also note that upon agreeing to participate in the study, the participants then receive the first screen page of the survey. What happens to those who choose not to participate? The procedures should also note that participants who do not consent to participate instead receive a debriefing statement that provides additional details about the study and contact information for the principal researcher.
In addition to describing the process leading up to survey access, the procedures also describe the survey instrument by noting how many questions are on the questionnaire, indicating whether questions are grouped into sections, noting the topic of each section, and listing the order in which the information will be received by the participant. For example, perhaps the questionnaire begins with 10 items that assess background information, followed by a 5-item personality scale or a 12-item behaviour inventory. The procedures also note what happens once participants complete the survey. In most cases, after completing an online survey, participants will receive the debriefing statement mentioned above. Finally, a copy of the questionnaire in its entirety, along with the consent form and debriefing statement, should be attached at the end of the proposal as an appendix.
Again, we would advise you to look at how the procedures are described in a couple of published journal articles, based on studies like the one you are planning, for additional ideas on what you need to include as necessary steps. Ask yourself the following questions as you prepare the method section:
- Did I indicate who the target participants will be and how I plan to obtain them?
- If I don’t have participants, did I explain what my units of analysis will be and how I plan to sample for them?
- Did I explain any relevant inclusion or exclusion criteria for selection?
- Have I noted where the proposed study will take place?
- Have I identified all materials that need to be obtained in advance of the study?
- For a quantitative study, have I listed and operationalized all main variables I plan to examine in my study?
- For a qualitative study, have I explained how I plan to code or categorize the information I will be collecting?
- Have I explained all steps I will undertake to carry out the study?
Data Analysis and Dissemination
In addition to describing the main variables and/or coding procedures, a research proposal also includes a brief section outlining the plan for data analysis and dissemination of findings. A quantitative study is likely to include statistical analysis using a software package especially designed for the social sciences, such as IBM SPSS or Stata statistical software. Data analysis in a qualitative study may be carried out by developing codes through transcription and textual analysis, or it can be assisted through specialized software programs such as NVivo, which helps to manage data by treating units of analysis as cases and organizing ideas, concepts, and themes into codes so that patterns and trends can be made apparent (Jackson & Bazeley, 2019). Here researchers can also indicate any strategies they plan to use to establish reliability, including inter-rater reliability and methods for obtaining rigour. Finally, a proposal outlines the plan for what will be done with the data once it is collected. Perhaps the researcher intends to report on the findings at an upcoming conference by presenting a conference poster (see Appendix B: Sample Student Poster for an example) or submit the main findings to a journal for peer review and possible publication.
Ethical Considerations
If a researcher plans to undertake a study that will include university students (or any humans) as research participants, as in the case of an experimental design, a survey project, an in-depth qualitative interview, or a focus group, the researcher would need to first obtain ethical approval through a university’s research ethics board. Even in the case of non-reactive research, if a researcher wishes to carry out a project that will in some way involve a university’s assets (directly or indirectly), as in the case of non-participatory observation in public spaces on campus, ethical approval will need to be sought from that university’s research ethics board. A research proposal always includes relevant ethical concerns along with the ways in which the planned study will address the concerns.
Minimal Risk for Harm
Recognizing that all research involving humans has at least a minimum potential for harm, a researcher should identify whether the proposed study can be judged as a minimal risk. While it is up to the research ethics board to determine whether the study is deemed minimal risk, a researcher can and should provide rationale for why the proposed project should be assessed as such. For example, a researcher who plans to conduct a survey on driving may indicate that there are no anticipated risks associated with participating in the proposed study. However, since the participants are disclosing information about their own driving habits, there is a minimal risk that participants may experience psychological discomfort when answering questions about the extent to which they engage in dangerous or aggressive driving practices. Specifically, participants could feel remorse or embarrassment while responding to certain questions. In addition, participants could later reflect on responses given and regret having disclosed information about their driving.
Mitigating Minimal Risk of Harm
To help mitigate this potential likelihood of harm, a researcher can include explicit information in the initial consent form to give the potential participants an idea of the type of questions they can anticipate being asked during the survey. For example, participants might be informed that they will be asked to report on safe and unsafe driving practices. In addition, the researcher can even include examples of specific items on the survey (e.g., Question #25 asks “How often do you send or receive text messages while stopped at a red light?”).
Researchers can also include a statement within the questionnaire itself that reiterates that participation is voluntary, that participants may skip over questions they do not want to answer, and that they can choose to end their participation at any time without penalty. Finally, a researcher can include additional self-help resources with the debriefing statement, such as resources for driver education and training.
Addressing Beneficence
Recall from chapter 3 the importance of designing a study in a manner that minimizes harm while maximizing the overall benefit of the research. Where possible, a research proposal should include a statement about the benefits of the proposed study for the researcher. For example, might the research help to fulfill the requirements for an honours project or a master’s thesis? In addition, it is important to list potential benefits for the participants, such as the opportunity to learn more about themselves or research processes. Finally, the proposal should also indicate benefits to the wider research community and/or society more generally. For example, may the proposed study contribute toward our understanding of some group, phenomenon, or process?
Upholding Privacy and Confidentiality
A researcher also needs to detail the planned procedures for upholding privacy through the anonymity of participants, how safe and secure storage of data will be achieved, and how confidentiality will be upheld in the disclosure of findings. For example, a researcher will need to note whether any personally identifying information is going to be collected and, if so, how the researcher plans to safeguard the identity of individual participants. Note that participants need to be made aware of this prior to providing consent.
Part of the process of ensuring privacy includes a consideration and disclosure of who is going to participate in data collection (e.g., Will research assistants help to collect information?); who is expected to access to the data once it is collected (e.g., Will anyone other than the principal researcher assist in the transcription or coding?); and where data is going to be stored (e.g., Will the data be transferred onto a computer file that will be kept on a password-protected computer in a locked office of the principal researcher? Will field notes be kept in a locked cabinet in the secure office of the principal researcher?). A research ethics board will ask for information on these items as well as additional information, including how long any sensitive data will need to be stored (the recommended length being about two years) and how the data will eventually be disposed of (e.g., Will the notes be shredded?).

Prospective References
Finally, a research proposal ends with a list of relevant references. References included in a research proposal help to establish a scholarly context for the planned study. The references help identify, for example, the appropriate and relevant theories, theorists, and concepts that inform the proposed research. In addition, references can help to validate the proposed methodology. For example, perhaps the researcher plans to use a grounded theory approach such as one described by Kathy Charmaz in 2014.
References are listed on a separate page in a standard citation format such as the one provided by the seventh edition of the American Psychological Association’s (2020) publication manual (APA format). In APA format, an author of a book is listed by last name, followed by first initials, year of publication, title, edition (if applicable, and then the publisher according to specific rules for style and punctuation. As illustrated here, in APA format, only the first word of the title of a book is capitalized, and the title appears in italics. MLA and ASA format are similar, as shown below.
APA format:
Charmaz, K. (2014). Constructing grounded theory (2nd ed.). Sage.
ASA format:
Charmaz, Kathy. (2014). Constructing Grounded Theory. 2nd ed. Thousand Oaks, CA: Sage.
MLA format:
Charmaz, Kathy. Constructing Grounded Theory. 2nd ed., Sage, 2014.
Activity: Research Proposals Review
Test Yourself
- What are the two primary questions addressed by a research proposal?
- Does the introduction section in a research proposal begin with a broad or narrow statement?
- In which section of a research proposal would you expect to find information on the setting and materials for a study?
- Which subsection of a research proposal walks the reader through the study?
- What suggestions might researchers propose to mitigate the risk of harm to participants?
THE RESEARCH REPORT
A research report is a formalized summary of a completed research project. A research report is written in a standard format that you can use to describe the research you have carried out for an undergraduate research class, an honours project, an independent study, a community-based project or some kind of field placement. This format includes a title page, an abstract, an introduction, a method section, a results section, a discussion section, references, and if applicable, tables, figures, and an appendix, as described in detail in this section and demonstrated in Appendix A: Sample Student Report. Research reports submitted to an academic journal may require additional elements depending on the journal submission guidelines, the most common of which are referred to below and discussed in more detail in this APA Sample Professional Paper (archived version) produced by the Purdue Online Writing Lab.
Title Page
The title page is much more than just a placeholder for the title of the study—it not only identifies what was studied, it provides additional information that helps to locate and establish the study within the greater context of the discipline in which it is situated. First, a title page includes a long title that summarizes what the study was about. There is no required minimum or maximum word length; however, the title should contain enough information to give the reader a sense of the specific research objectives. For example, “Sleep Quality” as a title would help identify the area of interest but not what the study was about. In contrast, Semplonius and Willoughby’s (2018) full title, “Psychosocial Adjustment Throughout University: A Longitudinal Investigation of the Roles of Sleep Quality and Emotion Dysregulation,” informs readers that the relationship between sleep and emotions is being studied over time.
In addition to the full title, a title page for a student report usually includes the names of student authors, the university, the course, the instructor, and the due date. Meanwhile, a professional paper submitted to a journal for publication usually includes the names of authors listed in order according to who contributed most to the research project and a running head, which is a shortened version of the title that appears in the header of the manuscript. Further down the page, title pages for professional papers also often include an author note that includes a recognition statement for the source of any relevant funding and how to correspond with the principal researcher for more information about the study. The recognition statement cites the source of support for the study, such as an external research grant (e.g., the Social Sciences and Humanities Research Council) or an internal source of funding (e.g., a research fund from within a department or school, or a university’s research office). The correspondence statement lists the name and email address of the main contact person or the principal researcher for the study so that interested readers and other researchers can reach the person for more information about the study.
Abstract
Located at the beginning of a research project, an abstract is a brief overview of the research project. It summarizes what the research is about, how many participants there were and how they were obtained (or what the units of analysis were), what the procedures were for carrying out the study, what the design consisted of, and what the main findings were. This can be considered the most important section in the entire report, as it is generally the first and sometimes the only section that is read by other academics and researchers conducting searches for relevant articles of interest. Although it appears at the beginning of a report, it should be the last thing the researcher writes, to ensure that it is both succinct (i.e., usually 150–250 words) and comprehensive. This is one of the most difficult sections to write, as it needs to include a lot of information in what amounts to only a few sentences. A good strategy for writing an abstract that is under 250 words is to first write an abstract that includes all relevant information (this will likely be about 300–400 words on your first try), and then rework it a few times, paring it down word by word, until it is as concise as possible.
If submitting an article for publication, journals may also require a short list of relevant keywords beneath the abstract, which are concepts used to locate the article via database searches once it is in print. Keywords also give the reader additional insight into the study. For example, readers interested in the interrelations between sleep, depression, emotion dysregulation, and alcohol might benefit from reading Semplonius and Willoughby’s (2018) study.

Introduction
An introduction section follows the abstract. Like the research proposal, an introduction in a research report should include a general opening and a broad discussion of the research interest and area, followed by a narrowing of the research topic. In addition, the research topic should be situated within the relevant literature, and the theoretical context and key concepts should all be well articulated. After summarizing the relevant literature, the introduction ends with a statement of the research problem, key question(s), issues explored, and/or hypotheses tested.
For example, in a research project on pain that I conducted for my master’s research, the broad opening statement in the journal article I published was “Pain is a fundamental fact of life” (Symbaluk et al., 1997, p. 258). From there, the introduction narrowed to discuss forms of acute and chronic pain in everyday life. It further narrowed as we brought in the social psychology of pain and established how monetary incentives and social modelling have been used in experimental research to increase pain endurance. It continued to narrow as we identified gaps in the literature and explained how this experiment was the first to look at the role of self-efficacy and pain perception as potential mediators for the anticipated effects of money and modelling on pain endurance. The introduction ended with specific hypotheses, including one predicting that pain endurance would increase as a function of money for participants who were exposed to pain-tolerant social models.
Note that the introduction section for a qualitative research project also summarizes the relevant literature and ties that literature to the research interests of the present study. However, in lieu of hypotheses, this section is likely to conclude with a statement of the research objective or the main question (or questions) explored in the study that follow logically from the literature review (Pyrczak & Bruce, 2017). For example, a qualitative study conducted by one of my students in an introduction to research methods course focused on the reproduction of common stereotypes in popular media. Finlay’s (2012) research question was “Does the popular television series Crime Scene Investigation promote or resist common stereotypical media representations of gender?”
Method
The method (sometimes called methodology) section of the research report is next. The method section is generally the longest in a report, as it contains subsections on the participants or selection of a sample, setting and materials, procedures or coding scheme, dependent or main variables, and data analysis.
Participants and How They Were Obtained or Sample and Sample Selection
For research involving humans as participants, this section notes how many participants were included in the study, who the participants were, and how they were obtained. For example, Sabbane et al. (2009) experiment on the effects of anti-smoking warnings on attitudes and smoking intentions included 178 teenagers (N = 178) as participants. Specifically, participants were males and females between the ages of 12 and 17 who were non-smokers (n = 158) or occasional smokers (n = 15) recruited, with parental consent, from Secondary I classes in a Montreal secondary school.
As a second example, Boyd et al. (2009) analyzed the content of media representations of bovine spongiform encephalopathy (BSE), more commonly known as “mad cow disease” for the first 10 days following an outbreak in Alberta on May 20, 2003. Their sampling frame consisted of The Globe and Mail and the National Post (as leading national papers), as well as The Lethbridge Herald (as a local Alberta newspaper) and the Edmonton Journal (as a regional newspaper). The sampling procedure involved online searches of these papers for articles on mad cow disease identified through keywords. From this potential sample, articles were included if they met additional criteria. For example, articles that only peripherally mentioned BSE (i.e., it was not the focus of the study) were excluded, resulting in 309 articles in the sample used (Boyd et al., 2009).
Finally, as a third example, Dr. Rosemary Ricciardelli interviewed 14 men as part of a study on the role of hair in self-identification. The interviewees were recruited through convenience sampling via four means of advertising the study, including business card advertisements for the study given out and left in coffee shops and shopping centres in the Greater Toronto Area, an email invitation sent out to students in a small suburban university, an advertisement in Fab magazine, and an ad in a free gay publication (Ricciardelli, 2011).
Setting and Materials
As addressed in the research proposals section above, the setting refers to the location where the data collection takes place. For example, in a study looking at the meaning of recovery from the perspective of Canadian consumers receiving mental health services, Piat et al. (2009) conducted interviews at major mental health service sources, including the Wellington Centre of the Douglas Mental Health University Institute, the Canadian Mental Health Association Waterloo/Wellington-Dufferin branches, and at the Programme d’encadrement clinique et d’hébergement. If the setting does not apply, as might be the case if the study was conducted over the internet, then this section would refer to materials only.
The materials refer to the main instruments and supplies used to carry out the procedures of the study. In an experiment, whatever is manipulated as the independent variable likely constitutes a material that requires preparation in advance of the study. For example, in a study on social-information processing as a function of psychopathic traits, Wilson et al. (2008) showed participants artificially created characters and then examined recall and recognition. The characters were profiles developed ahead of time that consisted of eight stimulus characters created with images of faces from the Pictures of Facial Affect (POFA) series put together with descriptions that contained a name, an occupation, and a set of likes and dislikes.
Note that indexes, scales, and other items used to compose a questionnaire given as part of survey research are generally described as main variables or measures after the procedures (not as materials needed to carry out the study).
Procedures
The procedures section of a research report details how the study was carried out. This subsection within the methods is written in the past tense, and it includes a description of all phases of the study, beginning with any instructions given to participants and the consent process, followed by details on the type of techniques employed to gather data and to later examine it. For example, if interviews were conducted, the researcher needs to indicate how many times each participant was interviewed and the time frame over which data collection (interviewing) took place. Alternatively, if observations occurred, when, where, and under what conditions did these take place? As another example, if an experiment was employed, how did participants experience the independent variable? Instead, if the study was based on ethnography, how did the researcher access the setting? Who were the gatekeepers and how was the gatekeeping process navigated? How was rapport with group members established? What role did the researcher engage in for data collection purposes (e.g., participant observation)? What methods were used to collect data? How did the researcher disengage from the setting at the completion of the study?
Note that if the study was based on content analysis, instead of procedures, a research report could include a section on coding procedures or a coding scheme. Similarly, if the study was based on secondary analysis of existing data, this section would outline why and how that source was selected and obtained, and how the archival material was organized and synthesized for subsequent data analysis (Neuman & Robson, 2024).
Main Variables or Measures
A research report always includes a section that outlines the main variables examined in the study. If the study is an experiment, the dependent variables are listed along with their operationalized definitions. For example, in the pain experiment I conducted for my master’s research, pain perception was operationalized as the time elapsed prior to the first sensation of pain in seconds, and pain endurance referred to how long a participant held an isometric sitting position in minutes and seconds (Symbaluk et al., 1997).
As another example, in a study looking at alcohol content as a mediating factor for brand preference, Segal and Stockwell (2008) employed measures of intoxication and enjoyment completed by participants after they drank two low-alcohol- or two regular-alcohol-content beers. Their measures section included a description of an objective variable based on blood-alcohol content assessed using a standard instrument called the Alco-Sensor IV, and it included a description of three subjective measures. Each subjective measure was listed along with appropriate citations for the originating source and an account of the measure. For example, one measure was The Sensation Scale, which they note was originally developed by Maisto et al. (1980) and consists of 31 items about the effects of alcohol. The measures section also notes that participants scored the items using Likert responses ranging from 0 (not at all) to 9 (extremely), with the higher ratings referring to higher intoxication.
If the study is based on qualitative research, as would be the case for in-depth interviews or most focus group sessions, the research report might not have a section for the main variables or measures. This is because concepts, themes, and main ideas may emerge during data collection and analysis in response to open-ended questions. However, if interviews or focus-group sessions are more structured, a researcher may include the questions or describe items that compose an interview guide as part of a section titled interview guide (in lieu of main variables).
Data Analysis
The last part of the method section of a research report details how data analysis was carried out. For example, if content analyses employed the frequency of occurrence of certain categories of events, how were the categories developed? Specifically, did the researcher use categories already established in the literature, modify categories based on previous literature, or develop new ones? Were categories counted once or every time there was an instance of that category? And how was reliability assessed? Did the researchers employ inter-coder reliability and, if so, what was the reliability rate achieved?
As another example, the process for data analysis in an ethnographic study of young homeless men in Calgary was described as follows: “Interviews were transcribed verbatim and checked for accuracy against the digital recordings. A thematic framework was agreed upon by the authors (SP and LM), based on the reported significance of daily routines, coping strategies, and access to services. This was used along with an open coding strategy to recursively analyze these findings using NVivo 7, a qualitative analysis software (QRS International, 2007). Data analysis was concurrent with data collection and uncovered common themes among the interviewees” (Persaud et al., 2010, p. 345).
Academic writing is challenging. You want to be clear and concise, avoiding jargon and unnecessary details, while at the same time having to explain complex practices and procedures that go into conducting social research. The good news is that most universities have writing centres with online resources and expert staff to help you learn how to write research reports and other forms of scholarly communication. As an example, the University of York Writing Centre has created a useful video on how to write a methods section:
[Video transcript – See Appendix D 12.1] Methods: structure is by University of York Writing Centre. Used with permission.
Alongside free online resources, several universities also provide students with tools like Grammarly, a writing assistant that uses artificial intelligence to give you immediate feedback on your writing.
Results
The results section of a research report outlines the main findings of the study in the appropriate technical terms. If there are several dependent variables or measures, each variable might be listed as a subheading in this section. Note that the results section states only facts, as succinctly as possible. In the case of quantitative research, the results section for an experiment is likely to report on findings based on tests of differences between means using t-tests for two groups or analysis of variance for variation between and within more than two groups or categories. The results section for quantitative survey research is likely to describe main variables (e.g., using measures of central tendency and variability), as well as report on tests for associations between variables of interest, such as correlations, regression analysis, or nonparametric measures of correlation.
The results section may include figures and tables, as discussed below, if they are necessary to help the reader understand the information being shared. If they are instead supplementary information that may distract a reader from the content, they can instead go in an appendix at the end of the report. When submitting a report to a journal for publication, you may also ask to include figures and tables after the references at the end of a report; an editor then styles and includes them to the text when preparing the file for publication. In each of these instances, the text of your paper should include a “callout” referencing each figure or table, which should be labelled sequentially, to draw the reader’s attention to this information (e.g., for an example of a pie chart included in the text, see Figure 12.1; to review how a table may appear in an appendix, see Appendix A of this book).
Coding and the Development of Categories
In a qualitative research report, results typically document the findings from the coding methods employed in the study. The coding methods involve stages or phases, beginning with initial codes. As described in various earlier chapters, data obtained in a study are assigned labels or codes. Specifically, a code “is most often a word or short phrase that symbolically assigns a summative, salient, essence-capturing, and/or evocative attribute for a portion of language-based or visual data” (Saldaña, 2021, p. 5). Recall that qualitative data includes a range of information, from narrative and text based on interviews and field notes to drawings and images presented in magazine ads, shown through character portrayals on television, and so on. A posting on RateMyProfessor.com, for example, might contain the passage “She really knows her stuff,” coded as “instructor” and “knowledge” since the passage refers to the instructor and it contains a comment about an attribute of the instructor. To begin with, each unit of data is usually assigned its own specific code.
After the initial codes are determined, the next phase includes going back over the data to determine if there are patterns in the data that can be coded into categories based on their common elements. For example, perhaps lots of comments refer to the instructor. Some of the comments might pertain to instructor attributes, such as comments about the instructor’s knowledge of the subject matter and comments about the instructor’s willingness to help students. Other items might have to do with an instructor’s grading, such as “The instructor is a hard marker” or “The instructor grades fairly.” Finally, other comments might pertain to assignments in the course, such as “This course has a lot of papers!” One large category to emerge from this data might be “comments about the instructor.” Another category might be “comments about the course content.” Within the “comments about the instructor” category, other subcategories could also be identified. For example, there may be a subcategory for “instructor attributes.” Within the subcategory for “instructor attributes,” researchers could also list codes for “clarity,” “helpfulness,” “knowledge,” and so on.
Qualitative data analysis is a lengthy process that eventually culminates in the development of themes, as Saldaña (2021) points out, “a theme can be an outcome of coding, categorization, or analytic reflection, but it is not something that is, in itself, coded” (p. 19). Results from qualitative studies, then, highlight main themes or claims that are descriptive outcomes identifying the main overall findings that emerged from the data collection and analysis processes. To substantiate the results, qualitative researchers need to carefully articulate each of the coding stages and categories that developed within each stage. Each main theme is generally discussed within its own subsection in the results, similar to how each main dependent variable is discussed for a quantitative study.
Figures
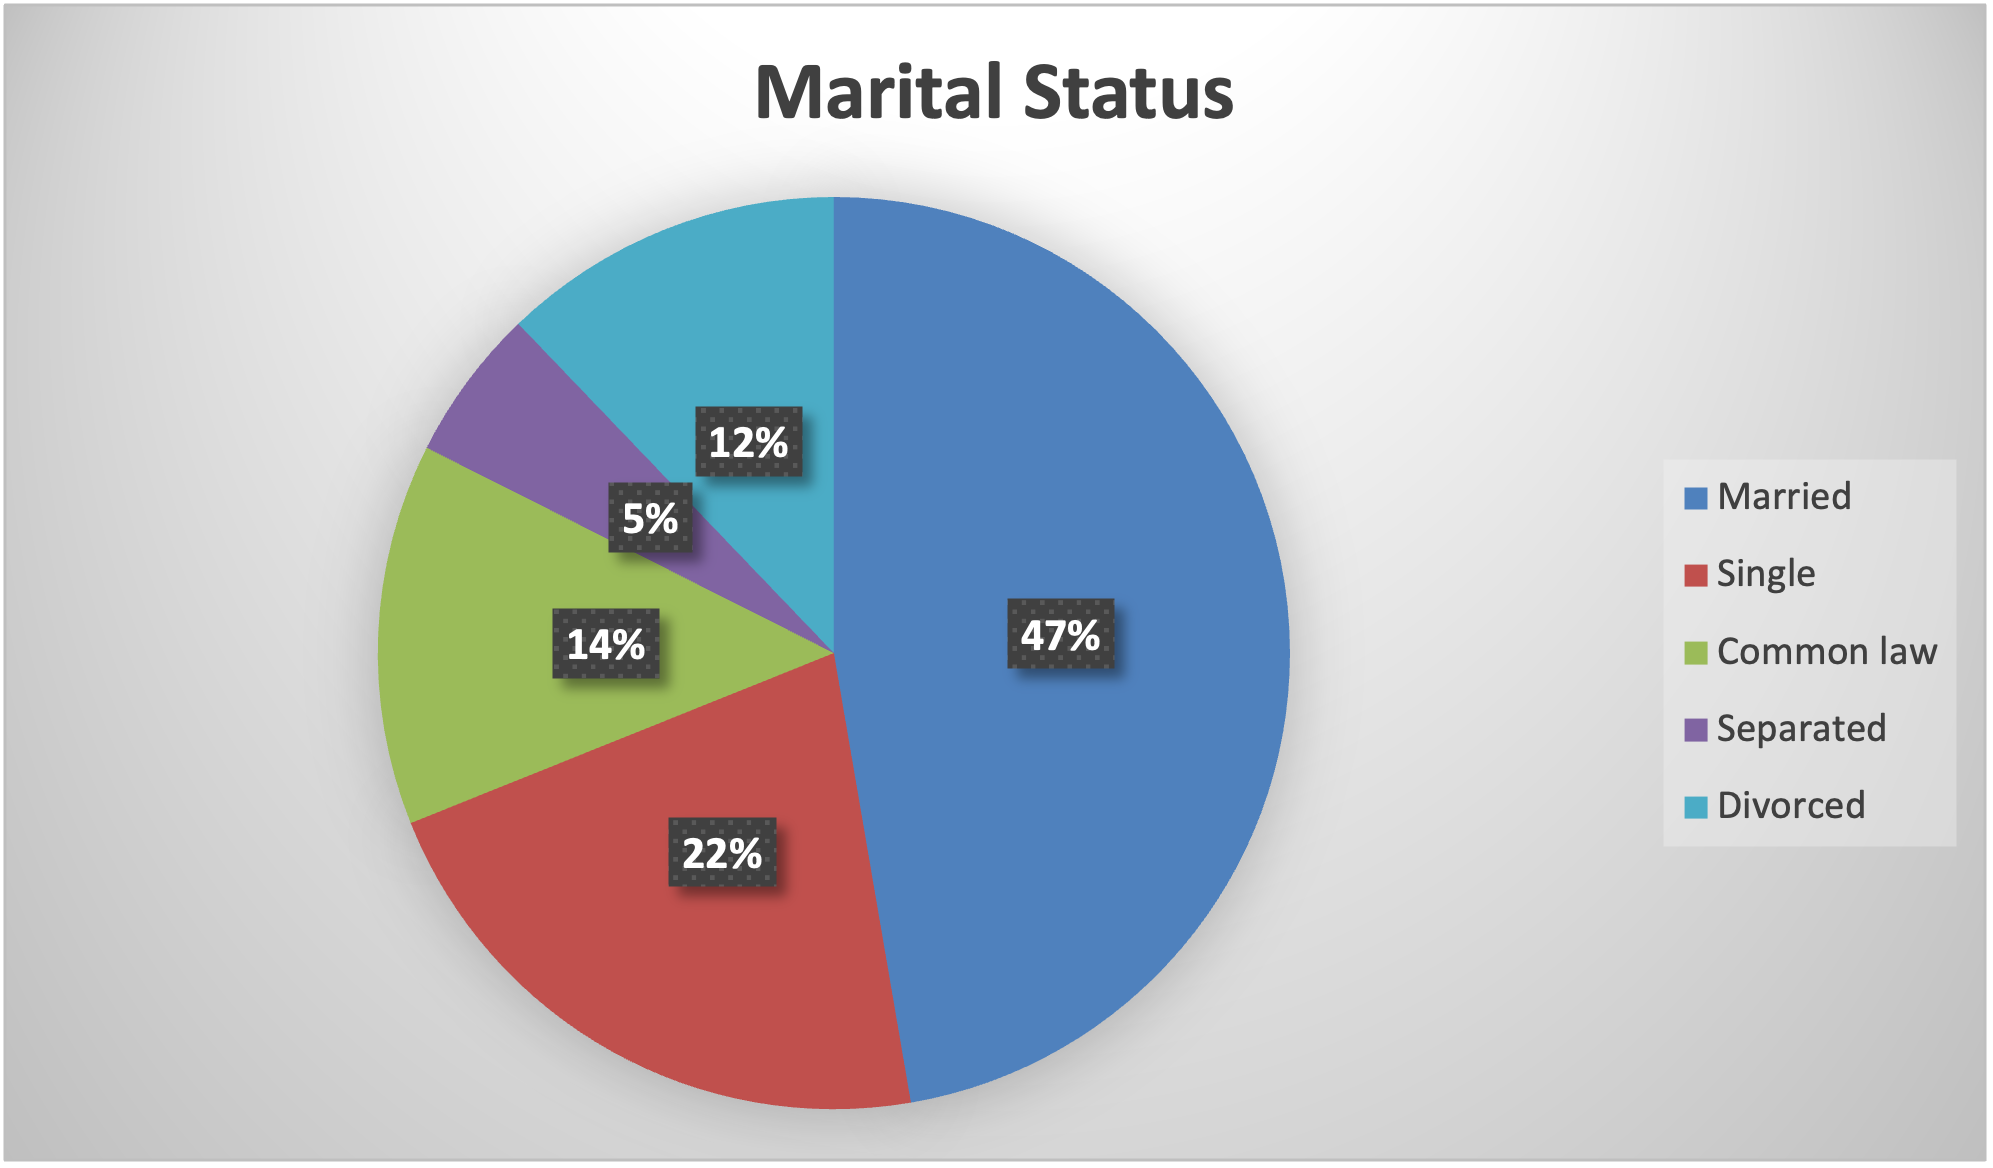
Results from research studies are often depicted in figures. Figures are charts or graphs used to display results based on how a variable is measured. A pie chart, for example, is used to depict the results in a picture format for a single, qualitative variable that is measured at the nominal level. For example, a researcher doing a content analysis on gender portrayals in the media might use a pie chart to convey that there are more males than females depicted as central characters on television. Or a researcher conducting an online survey on attitudes toward healthcare might use a pie chart to describe the respondents who completed the survey. Perhaps the largest slice of the pie indicates that many participants were married, followed by single, common-law, divorced, and separated (see figure 12.1). If none of the respondents claimed they were in a category (e.g., widowed), that category would not be included in the pie chart.
If it is important to indicate the frequency distribution for the categories of a variable, a bar graph would be used instead of a pie chart, since it emphasizes the number of respondents in each category of a variable and it can even be used to show the concurrent pattern of findings for two variables measured at the nominal level. In figure 12.2 we can still determine that more than half of the participants in this fictitious study on the effectiveness of a drug treatment program were married (86 + 11 = 97 out of 181). However, we can also note that there may be a relationship between treatment completion and marital status, since a higher proportion of respondents who were in a relationship (married or common-law) completed treatment relative to participants who were single or divorced (see figure 12.2).

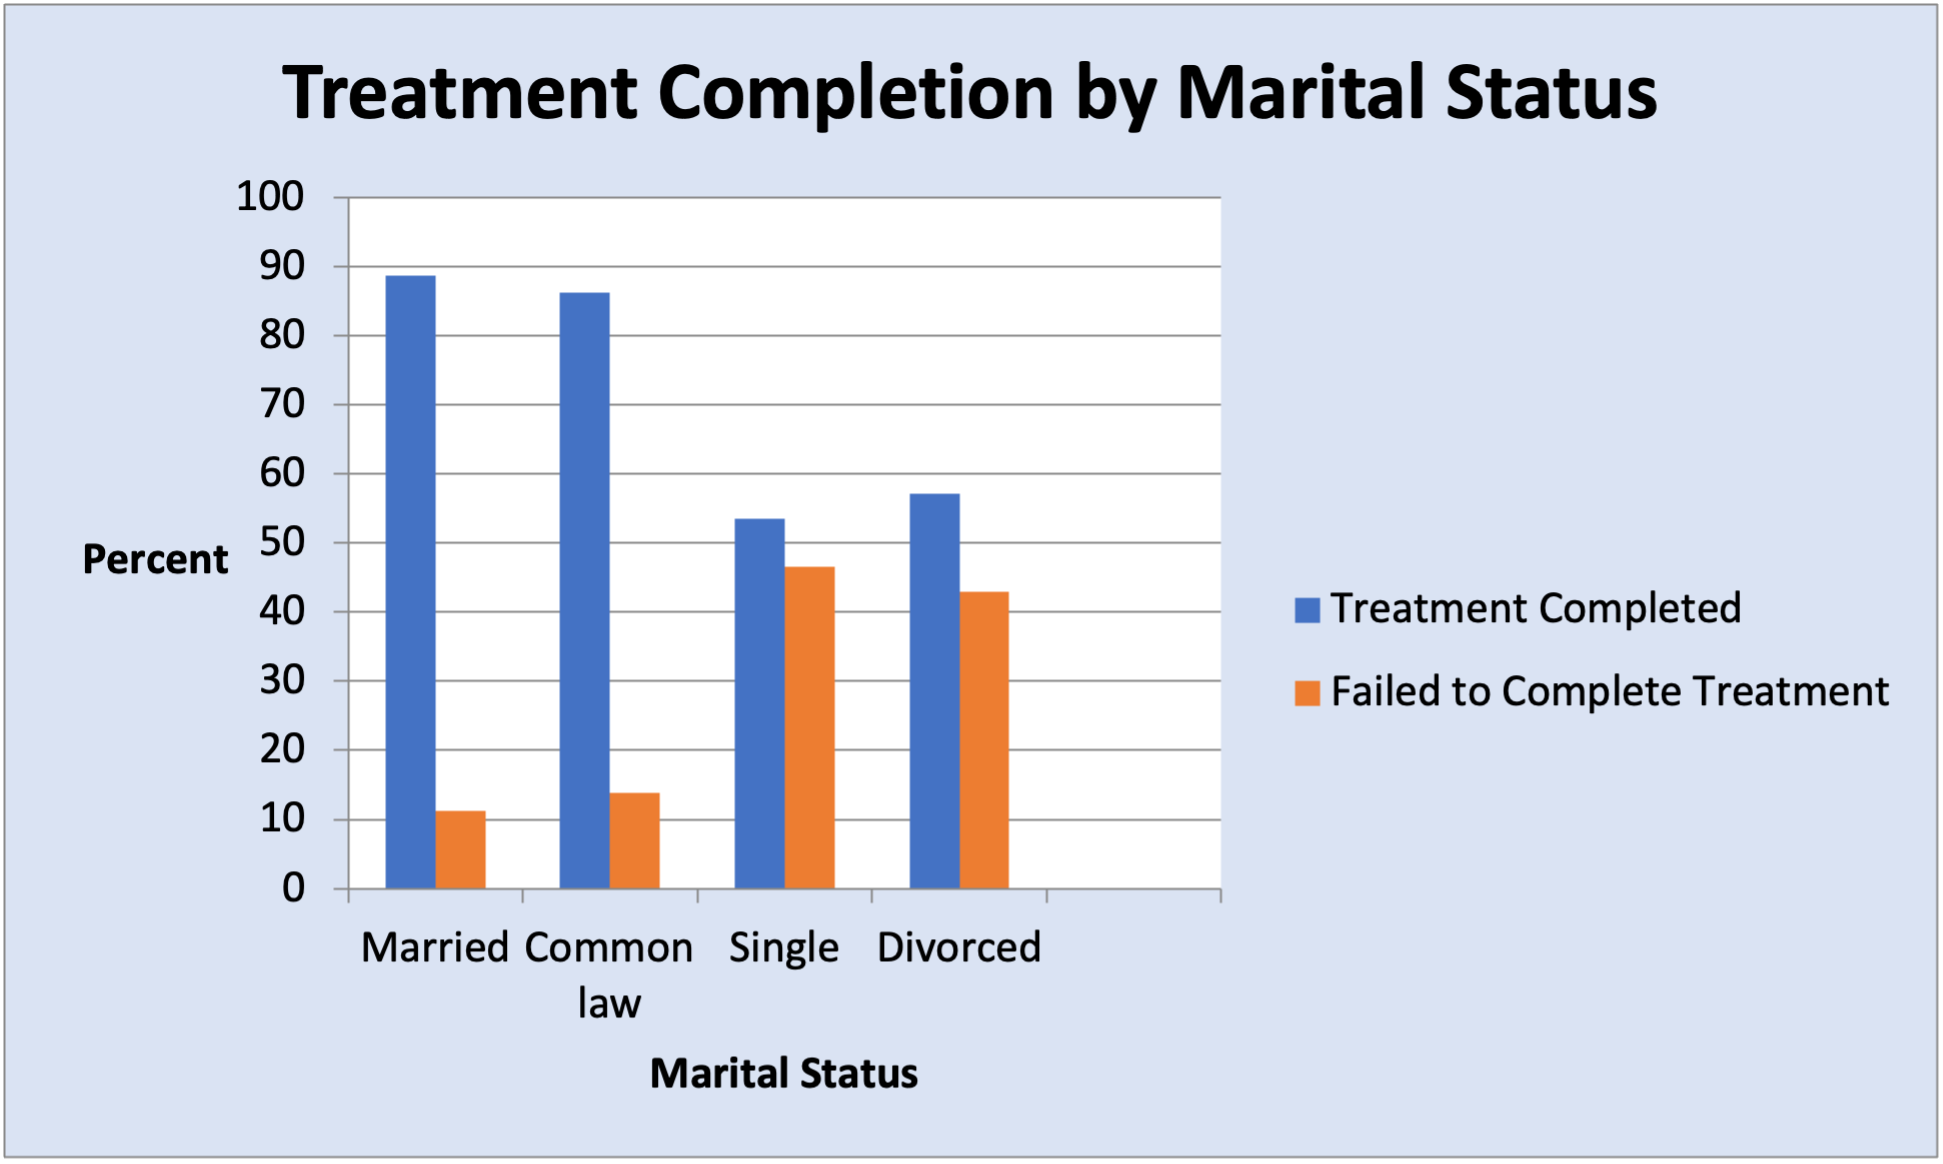
Bar graphs can also be used to display the distributions of responses across or within categories of a nominal variable, shown in percentages. For example, figure 12.3 shows the percentage of respondents in each marital status category who completed or failed to complete treatment. This figure more clearly illustrates the relationship between relationship status and treatment completion, as it is now obvious to the reader that the clear majority of those in relationships completed treatment, whereas those who are not in relationships appear to have just slightly higher than a 50-50 chance of success (see figure 12.3).
Tables
Tables are typically summaries of the main findings from quantitative research, such as the percentage of respondents who gave answers in each category of a variable on a questionnaire or the differences in means between groups on dependent measures. For example, Symbaluk and Howell’s (2010) study showed that students gave higher ratings to teaching-award winning instructors than to research-award winners on the popular website RateMyProfessors.com. In the results section, a table compared teaching-award and research-award recipients by listing the mean rating given by students for easiness, helpfulness, and clarity for the two groups of instructors (see table 12.1). Tables are also especially useful for indicating patterns in data over time (Nardi, 2006).
| Rating Variable | Teaching-Award Recipients | Research-Award Recipients |
|---|---|---|
| Easiness | ||
| M | 3.29 | 2.84 |
| SD | .61 | .81 |
| Helpfulness | ||
| M | 4.10 | 3.42 |
| SD | .76 | 1.07 |
| Clarity | ||
| M | 4.10 | 3.51 |
| SD | .72 | 1.10 |
| Note: Means and standard deviations are based on sample sizes of 120 for teaching-award recipients and 119 for research-award recipients. Ratings were made on five-point scales, with higher scores reflecting greater ease, helpfulness, or clarity. | ||
Discussion
In the discussion section of a research report, researchers summarize and elaborate on the main findings, highlight the importance of the findings, and tie them back into the wider literature. In addition, the discussion section notes limitations of the current study and identifies directions for future research. Since the results section focuses only on the findings, the discussion section is where the researcher can indicate what the results mean and whether the results are consistent with prior expectations, previous research, and/or the hypotheses tested in the study. In addition, researchers can elaborate on what the findings mean, why they are important, and how they can best be interpreted within the context of existing literature. A research report is often described as having the overall shape of an hourglass. Just as the introduction section began broad and narrowed to the focus of the current study, wherein the methods and the results sections are exclusive to the present study, the discussion broadens again until it finally generalizes back to the wider topic of interest.
After discussing the results in relation to the original research questions and wider literature, limitations are raised and suggestions for improvements are provided. All studies have strengths and weaknesses. Usually, a researcher will point out a few of the methodological limitations of the current study. Perhaps the sample size was smaller than desired, or perhaps the sampling method used was not ideal but was necessary under the present circumstances. Even if the most appropriate sampling method was used, as might be the case for a sample of convenience employed in an interview-based study on centenarians (people who live to be more than 100 years of age), inherent limitations such as the resulting inability to generalize the findings should be mentioned in the discussion. If secondary sources are used, there may be restrictions in terms of what can be explored given the different originating purpose of data collection. Usually, a researcher will indicate ways to improve on the present study or offer suggestions for future studies given the limitations discussed. A discussion typically ends with a statement of direction for academics interested in conducting further research in this area. Note that some authors choose to include a conclusion section as a separate section to end the report. A conclusion section summarizes the contributions of the present study and provides suggestions for future research and/or includes directives for policy initiatives.
References
The last section of a research report is a list of the sources cited throughout the report. The list is generally double-spaced in accordance with the rest of the report and is written in a standard style, such as the one provided by the most current version of the American Psychological Association’s (2020) style guide discussed earlier on.
Research on the Net
APA Style
APA is the most commonly used citation style in the social sciences. Most, if not all, academic libraries provide students with online resources and staff support to help with citation questions. Additionally, the American Psychological Association’s APA Style website provides examples of how to reference sources, including less commonly used sources like social media posts and audiovisual materials such as podcasts and YouTube videos. The website also provides guidance on how to set up tables and figures, and how to format your paper.
- What seven sections compose a standard academic research report?
- Why is an abstract so important?
- What is provided at the end of an introduction?
- What five subsections are described in the method section of a research report?
- Which section(s) include figures or tables?
- Where would a researcher indicate whether the findings obtained were the ones anticipated prior to the onset of the study?
OTHER ITEMS
Other optional items that may be included in a research report are an appendix and a list of acknowledgements.
Appendix
The appendix is a section or placeholder where a researcher can include additional information that may be relevant to other researchers, such as a scale or index used to construct questionnaire items, an interview guide used to assist a moderator in a focus group, a set of instructions provided to participants in an experiment, or a coding scheme adapted from the literature for use in a content analysis. Since the appendix is an extra section, it is generally not included in the page count for a research report.
List of Acknowledgements
A list of acknowledgements is sometimes included to pay tribute to individuals and organizations that helped to support the research. For example, research assistants, graduate students, or paid assistants who are not primary researchers or contributing authors are generally acknowledged at the end of the report. The researcher can also list agencies, groups, or organizations that provided funding in the form of grants, scholarships, and/or awards, along with any individual or organization that provided necessary materials, such as meeting space, for carrying out the study.
Test Yourself
- Why is a list of acknowledgements important to include in a research report?
Activity: Research Reports Review
CHAPTER SUMMARY
- Outline the main components of a research proposal.
A research proposal includes five main sections: an introduction, a method section, a section on data analysis and dissemination, a section on ethical considerations, and a listing of prospective references. - Explain the purpose of a method section in a research proposal.
The method section outlines who the participants will be and how they will be selected or how the sample will be obtained. In addition, a method section includes information on the setting and materials needed to conduct the study, the procedures for carrying out the study, and the main variables that are examined in the study. - Identify key ethical considerations that need to be addressed in a research proposal.
If a researcher plans to conduct research using humans as participants, the proposal should indicate why the study can be deemed minimal risk and how the minimal risk will be mitigated. The proposal should also include a statement that outlines the benefits of the study for participants, for the researchers, and for the wider academic community. Finally, the proposal should also include a discussion about how privacy and confidentiality will be upheld in the planned study. - Outline the structure and format of a scholarly research report.
A research report includes a title page, an abstract, an introduction, a method section, a results section, a discussion section, and references. The method section includes subsections on participants and how they were selected or the sample and how it was obtained, the setting and materials, the main variables or measures, and how data analysis was conducted.
RESEARCH REFLECTION
- Suppose you are interested in studying the prevalence of texting while driving. What method do you think would be most suitable for examining this phenomenon? If you were going use that method to study texting while driving, what ethical considerations would you need to address in a research proposal?
- Suppose you are interested in learning about effective strategies used by university students to prepare for final exams. Indicate what you would include in a research proposal in the section on participants. Specifically, who would your sample comprise and how you would go about obtaining participants?
- Suppose you want to explore the ways in which people treat their pets in comparison to how they treat members of their immediate family in an exploratory study for your master’s thesis. What kind of method would you employ to study this topic? Based on your choice of method, what sorts of information would you need to include in the results section of a research report based on the findings?
LEARNING THROUGH PRACTICE
Objective: To develop a research outline
Directions:
- Suppose you plan to carry out your course-assigned research project on gender portrayals in the mass media. Try to use the following questions and steps to develop an outline that is two to three pages long that could serve as a starting point for a research proposal on this topic.
- First, decide on one area of the mass media where you wish to examine gender, such as music, television, or social media.
- Next, identify relevant secondary sources for data on gender within the selected area of the mass media. For example, if you want to study gender in music, a relevant source would be music lyrics in songs within a genre, such as rap.
- Develop one or two general research questions that you could (potentially) examine using the secondary source identified in the previous step.
- Explain whether your study will be based on qualitative or quantitative research. Justify your approach.
- Describe the main method you plan to use to examine your question of interest. For example, will you be conducting a content analysis?
- Conduct a database search and locate one research article that examines gender and is relevant in some way to your proposed research topic.
- Describe a main research question or hypothesis examined in the article.
- Describe the method or methods used to answer the question of interest.
- Explain whether this article has provided you with any ideas or guidance for how to develop your own study in the area.
- Locate one secondary source of potential data for your study, such as finding and printing off the lyrics to one song.
- Do you think this source of data is a good one to include in your eventual sample? Why or why not?
- Describe the sampling procedure you would use to conduct your planned study.
- Examining the secondary source of data with your research questions in mind, what kind of data analysis do you think you would need to do? Explain the procedures for how you would carry out this analysis on a larger scale in your eventual study.
RESEARCH RESOURCES
- For step-by-step instructions on how to write research proposals and reports, refer to chapters 6 and 7 in Symbaluk, D., Hall, R., & Champoux, G. (2019). Navigating an undergraduate degree in the social sciences: Tips and strategies. MacEwan Open Books.
- For more information on ways to code qualitative data (e.g., descriptive coding, process coding, emotion coding, axial coding, theoretical coding), refer to Saldaña, J. (2021). The coding manual for qualitative researchers (4th ed.). Sage.
- To learn how to code qualitative data using NVivo software, refer to Jackson, K., & Bazeley, P. (2019). Qualitative data analysis with NVivo (3rd ed.). Sage.
- To learn about data analysis based on qualitative, quantitative, and mixed methods, refer to Bergin, T. (2018). An introduction to data analysis: Quantitative, qualitative and mixed methods. Sage.
- Opening quote by Professor Chris Whitty, chief scientific advisor for the Department of Health, published on January 1, 2019, from the National Institute for Health Research home page at nihr.ac.uk. ↵
A comprehensive plan created in advance of carrying out research that details what the purpose of the project is and what the process will be for obtaining data.
A detailed account, following research, that describes the research interest, questions or hypotheses addressed, methods used, and findings from the study.
A brief overview of a research project, which describes the participants or units of observation, the design, the procedures, and the main findings in no more than 250 words.
Charts or graphs used to display results based on how a variable is measure.
Summaries of main findings from quantitative research, such as the percentage of respondents who gave answers in each category of a variable on a questionnaire or the differences in means between groups on dependent measures.
