Chapter 5: Sampling
The national census collects information on every person living in Canada, including their age, sex, language, and income. Unlike a census, a survey collects information from only part (a sample) of the population being studied. The results are then used to draw conclusions about the whole group.
Learning Objectives
After reading this chapter, students should be able to do the following:
- Define sampling and differentiate between a population and a sample.
- Explain why a researcher might choose a probability-based sampling method and distinguish between simple random, systematic, stratified, and cluster sampling techniques.
- Identify the main advantages and disadvantages of probability-based sampling techniques.
- Explain why a researcher might choose a non-probability-based method and distinguish between convenience, snowball, purposive, and quota sampling techniques.
- Identify the main advantages and disadvantages of non-probability-based techniques.
- Explain how theoretical sampling differs from probability- and non-probability-based sampling techniques.
INTRODUCTION
Recall from chapter 4 how a research design details the plan for a study, beginning with whom the study is about. In addition to identifying the unit of analysis—such as individuals, groups, or organizations—a design also provides details on how the unit of analysis was selected. Sampling is the technique used to acquire the unit of analysis from a population of interest. You already use sampling in everyday life as you “sample” a grape or a cherry at a local supermarket before buying the entire bunch. Similarly, you might try a couple of food samples offered to you at a local market before choosing an item to purchase in greater quantity. If you are a parent, perhaps you have tried out or sampled several babysitters for short periods of time before settling on one that you feel is best suited for looking after your child for extended periods of time. Finally, you probably hang out with a select group of friends as opposed to everyone in your class, and you invite only certain people over from your place of work. In social research, an investigator sometimes selects a sample of individuals, or chooses a group or an organization to study, in hopes of generalizing the findings to a wider population of interest. In other cases, a sample is chosen because that group best suits the research problem, interest, and/or needs of the investigator. In this chapter, you will learn why it is important to sample, what the relationship is between samples and populations, and how to conduct probability- and non-probability-based sampling.

POPULATIONS AND SAMPLES
A population is “the total collection of all cases in which the researcher is interested and that they wish to understand better” (Healey et al., 2019, p. 8). As noted in the opening passage, Statistics Canada’s census population is every single person living in Canada, while another population of interest to Statistics Canada researchers is all employed Canadians. Statistics Canada’s Labour Force Survey questions about 56,000 households across Canada every month (a sample) to estimate the total population of employed and unemployed Canadians (Statistics Canada, 2024c).
As another example, all students enrolled at the University of Toronto might compose a population for a researcher interested in views on tuition costs. Universities keep records on registered students, including their status as full-time or part-time, their home mailing addresses and phone numbers, and so on. From fall 2022 to winter 2023, U of T had an enrolment of 97,678 students (University of Toronto, 2024). While the population is “known,” it would be difficult to locate every student since some students change addresses and phone numbers without updating their contact information. In addition, some of the students who can be located may be too busy or otherwise uninterested in participating in the study. Finally, it could take years to complete a study with tens of thousands of participants and it might be too costly to do so. An important question, then, is whether it is necessary to include the entire student body. The short answer is “no.” Using techniques discussed in this section, a smaller sample of students can be obtained for use in a study and their views can be indicative of the larger population.

Finally, Toronto’s homeless might constitute a population of interest to a social worker from the University of Toronto interested in the daily challenges faced by individuals who are living on the street. It is generally not possible to identify or locate all homeless people living in and around Toronto; therefore, it would be very difficult to even determine who composes the population of interest. Instead, a researcher could examine homelessness using secondary resources, such as reports from local agencies that deal directly with homeless individuals in the area or conduct interviews with employees of agencies that work with homeless people. Alternatively, the researcher might opt to speak with a small number of homeless individuals who agree to participate in the study. While likely not representative of the entire population of interest, such a sample is likely available for inclusion in a study and it will still constitute an important unit of analysis, especially as a starting point, to learn about challenges facing homeless individuals.
SELECTING A SAMPLE
Researchers use two main types of procedures to obtain a sample: probability sampling and non-probability sampling. Probability sampling is a method in which every individual or element in the population has a known chance of being selected. Non-probability sampling is a method in which the chance of selection of an individual or element in the population is unknown.
Test Yourself
- What is sampling and when might you use this in everyday life?
- What is the relationship between a sample and a population?
- What is the difference between probability and non-probability sampling?
PROBABILITY SAMPLING
Probability sampling is used when a researcher wants a representative sample. “A sample is representative of the population from which it is selected if the aggregate characteristics of the sample closely approximate those same aggregate characteristics in the population” (Babbie & Edgerton, 2024, p. 155). For example, if a population consists of students who are mainly enrolled full time and taking classes in the day, then those students who end up in the sample should also be mostly full-time students who attend day classes. To the extent that this is true, the findings obtained from the sample will generalize to the larger population. This is very important when the researcher wants to accurately capture the views of the entire population, but the population is so large that it would be difficult if not impossible to include every member in a study. A survey on the views of people living in the province of Ontario or a survey on the views of all Canadians are examples of projects best carried out with probability sampling. Most surveys conducted by Statistics Canada utilize probability sampling. Probability sampling relies upon known probabilities concerning the proportion of times an event will occur. For example, when you roll a die and you hope for a “five,” the probability of obtaining a five is one chance in six, since there are six possibilities on the die (1, 2, 3, 4, 5, 6). Similarly, when you flip a coin and you hope for “heads,” the probability of obtaining heads is one out of two (or 0.5), since there are two possible outcomes (heads and tails). With probability sampling, the population must be known (i.e., every member is identifiable to the researcher). In the example used earlier on, it is possible to identify all 97,678 students attending the University of Toronto via a list generated by the Registrar’s office. The complete list of 97,678 students is called a sampling frame. If a sampling frame can be made available, then the researcher can calculate probabilities, and probability sampling is possible. Four types of probability-based sampling techniques are described here.
Simple Random Sampling
Simple random sampling is a method used to obtain individuals (or cases) that make up a sample based on chance alone. For example, if we randomly select one student from the U of T sampling frame, this means that student, like any other student at U of T, has a 1 in 97,678 chance of being selected. Note that the term random is not to be confused with haphazard, as in any method will work. Random only means that chance alone determines the selection based on probability. For example, imagine 10 people attend a meeting and all 10 people write their names on little slips of paper of the same size, which are then put into a hat and mixed around, and one is randomly drawn for a prize. Each person in attendance has an equal chance of winning, with a probability of 1 out of 10. But what if two or three prizes are to be given out? “Sampling with replacement” means the first person drawn would be put back into the hat for another try at a prize, keeping the odds at 1:10 for all members in attendance, including the person who already won a prize. However, research in the social sciences (like many door prize raffles) is usually carried out using “sampling without replacement.” This means that after the first person wins the prize, they are taken out of the draw. The odds for the next prize winner then change to 1:9, and for a third prize to 1:8. While the probability of selection for each case (or element) from the population is always known, the probability of selection for each case is not always identical.

To obtain a random sample without replacement, a researcher would need to follow these steps:
- Generate a complete list of all of individuals in the population.
- Number every individual in the sampling frame.
- Use a random numbers table to randomly select the sample of a specific size as described below.
A random numbers table is computer-generated listing of random numbers. There are various internet sites that contain tools for generating random number tables (e.g., stattrek.com). These are straightforward to use: simply enter how large a sample you wish to include in your study (e.g., 100), which numbers represent the sampling frame (e.g., for the University of Toronto example above, the minimum possible value is 1 and the maximum value is 97,678), and that you wish to use sampling without replacement. When the table is generated, it will include only 100 randomly selected non-repeating numbers within that range. For example, the first number might be 54243, meaning the first person included in the sample will be the student whose name is beside the number 54243 on the sampling frame. Going across the first row, the second number listed is 07462, indicating that the second person included in the sample would be whoever was numbered 7,462, and so until the 100th person, corresponding to whoever is listed as 51721 in the sampling frame (see figure 5.1).

Systematic Sampling
As a potentially more efficient alternative to simple random sampling, some researchers opt for systematic sampling. Systematic sampling is a method used to obtain individuals that compose a sample based on a fixed interval, representing every nth listed case. For example, using an interval of size of five, a random starting point is selected that is between 1 and 5, and then every fifth person listed in the sampling frame would be selected for inclusion in the sample. The fixed interval is called a sampling interval and it is calculated by dividing the population size by the desired sample size. Using our earlier example, 97678 ÷ 100 = 976.78 or, rounded to the nearest whole number, is every 977th student. The steps are summarized as follows:
- Generate a complete list of all of individuals in the population.
- Number every individual in the sampling frame.
- Calculate the sampling interval by dividing the population by the desired sample size.
- Randomly select the first case. It should be a number between 1 and the size of the sampling interval. For the example above, it would involve randomly selecting a number between 1 and 977, such as 10.
- Use every nth number after that (as denoted by the sampling interval) until the number of cases selected reaches the desired sample size. In this example, the sampling interval is 977. The first person included in the sample would be whoever is listed at 10, then 987, then 1964, 2941, and so on until the desired sample size is reached.
Stratified Sampling
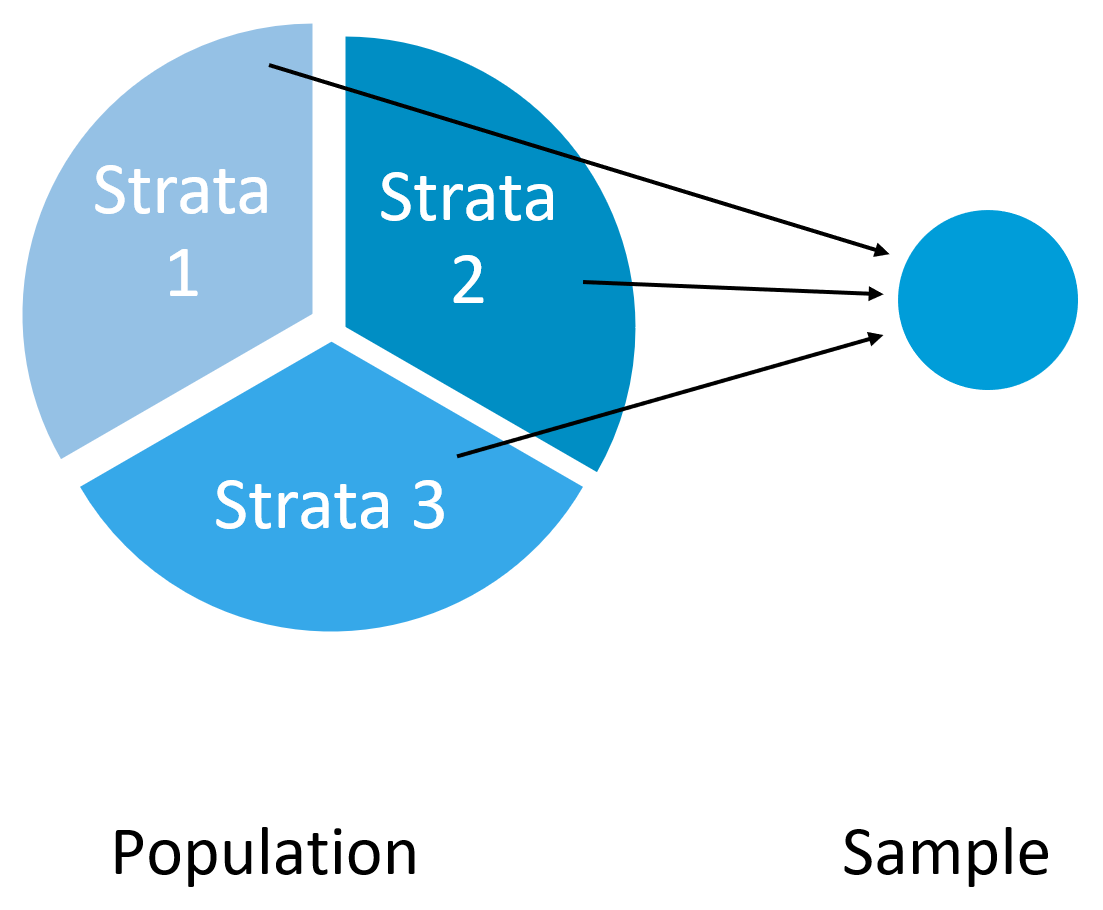
Stratified sampling is a method used to obtain a sample based on known population characteristics. Researchers using stratified sampling are trying to ensure that certain characteristics of the population, such as age, sex, ethnicity, education, location, or any other attribute deemed especially relevant to a given study, end up in the sample. To accomplish this, researchers divide the population into subgroups based on known characteristics and then randomly (or systematically) sample for a certain number of cases from each group (see figure 5.2).
For example, a researcher interested in 1,200 instructors’ views on abolishing student ratings of instruction might want a sample that includes full-time continuing instructors as well as those who teach on a part-time basis (often called sessional or term instructors). In this example, the instructors would first be grouped based on their teaching status (full-time or part-time). Each of the two groups is considered a “strata.” If the goal is a sample size of 100 instructors, 50 can be randomly selected from the part-time strata and 50 can be randomly selected from the full-time strata. While even subgroups are desirable for some statistical tests, this practice can detract from representativeness, depending on how the characteristic of interest is distributed in the population. For example, there are likely to be more part-time instructors overall, meaning that the sample obtained through the stratified technique is now somewhat less representative than what was obtained using simple random and systematic sampling. Researchers can, instead, opt for a “proportionate” sample that includes an equivalent ratio of relevant characteristics as exists in the population. For example, if 750 of the 1,200 instructors teach part-time, then 62.5 percent of the sample would also need to be made up of part-time instructors. This can be achieved if the researcher randomly selects for 63 part-time and 37 full-time instructors.
Finally, in some instances, a researcher may wish to specifically examine certain characteristics of importance and might purposely oversample for these traits. For example, if part-time instructors are known to have more reservations about student ratings of instruction because they hold only limited appointments without job security, a researcher might intentionally oversample part-time instructors to learn as much as possible about their concerns. Disproportionate sampling is the term used to describe a sampling method used deliberately to obtain a different ratio of relevant characteristics than what exists in the population.
Research in Action
Statistics Canada Sampling Methods
Most of the national surveys conducted by researchers at Statistics Canada include representative samples based on one or more of the probability-based techniques. For example, the Canadian Community Health Survey (CCHS), designed to assess the health and well-being of Canadians through a series of questions on health status, health determinants, and utilization of healthcare services, targets everyone 12 years of age and over living in the ten provinces and three territories (Statistics Canada, 2024a). Although the survey excludes a few groups, such as persons who are living on reserves, those serving in the Canadian Forces, and institutionalized populations, the sample has 130,000 respondents and represents about 97 percent of the Canadian population. The CCHS is based on a cross-sectional design and uses multistage stratified cluster sampling. First, clusters are selected based on geographic location, and then they are adjusted for the population size to ensure adequate representation from individuals of various ages. Finally, systematic sampling is used to obtain dwellings within the clusters (Statistics Canada, 2024a). The data collected by the survey is used by various organizations and individuals, including Health Canada, mental health services, and universities.
Cluster Sampling
In contrast to simple random, systematic, and stratified sampling methods, which all rely on the selection of cases one individual at a time, cluster sampling is a method for selecting groups based on their geographic location. Sometimes, even with a sampling frame it might not be feasible to reach every person who might end up in a sample, as might be the case if they are thinly spread across a huge geographic area. In such cases, a researcher might randomly sample a few clusters (or locations), and then everyone in the selected clusters would be included in the sample (see figure 5.3).

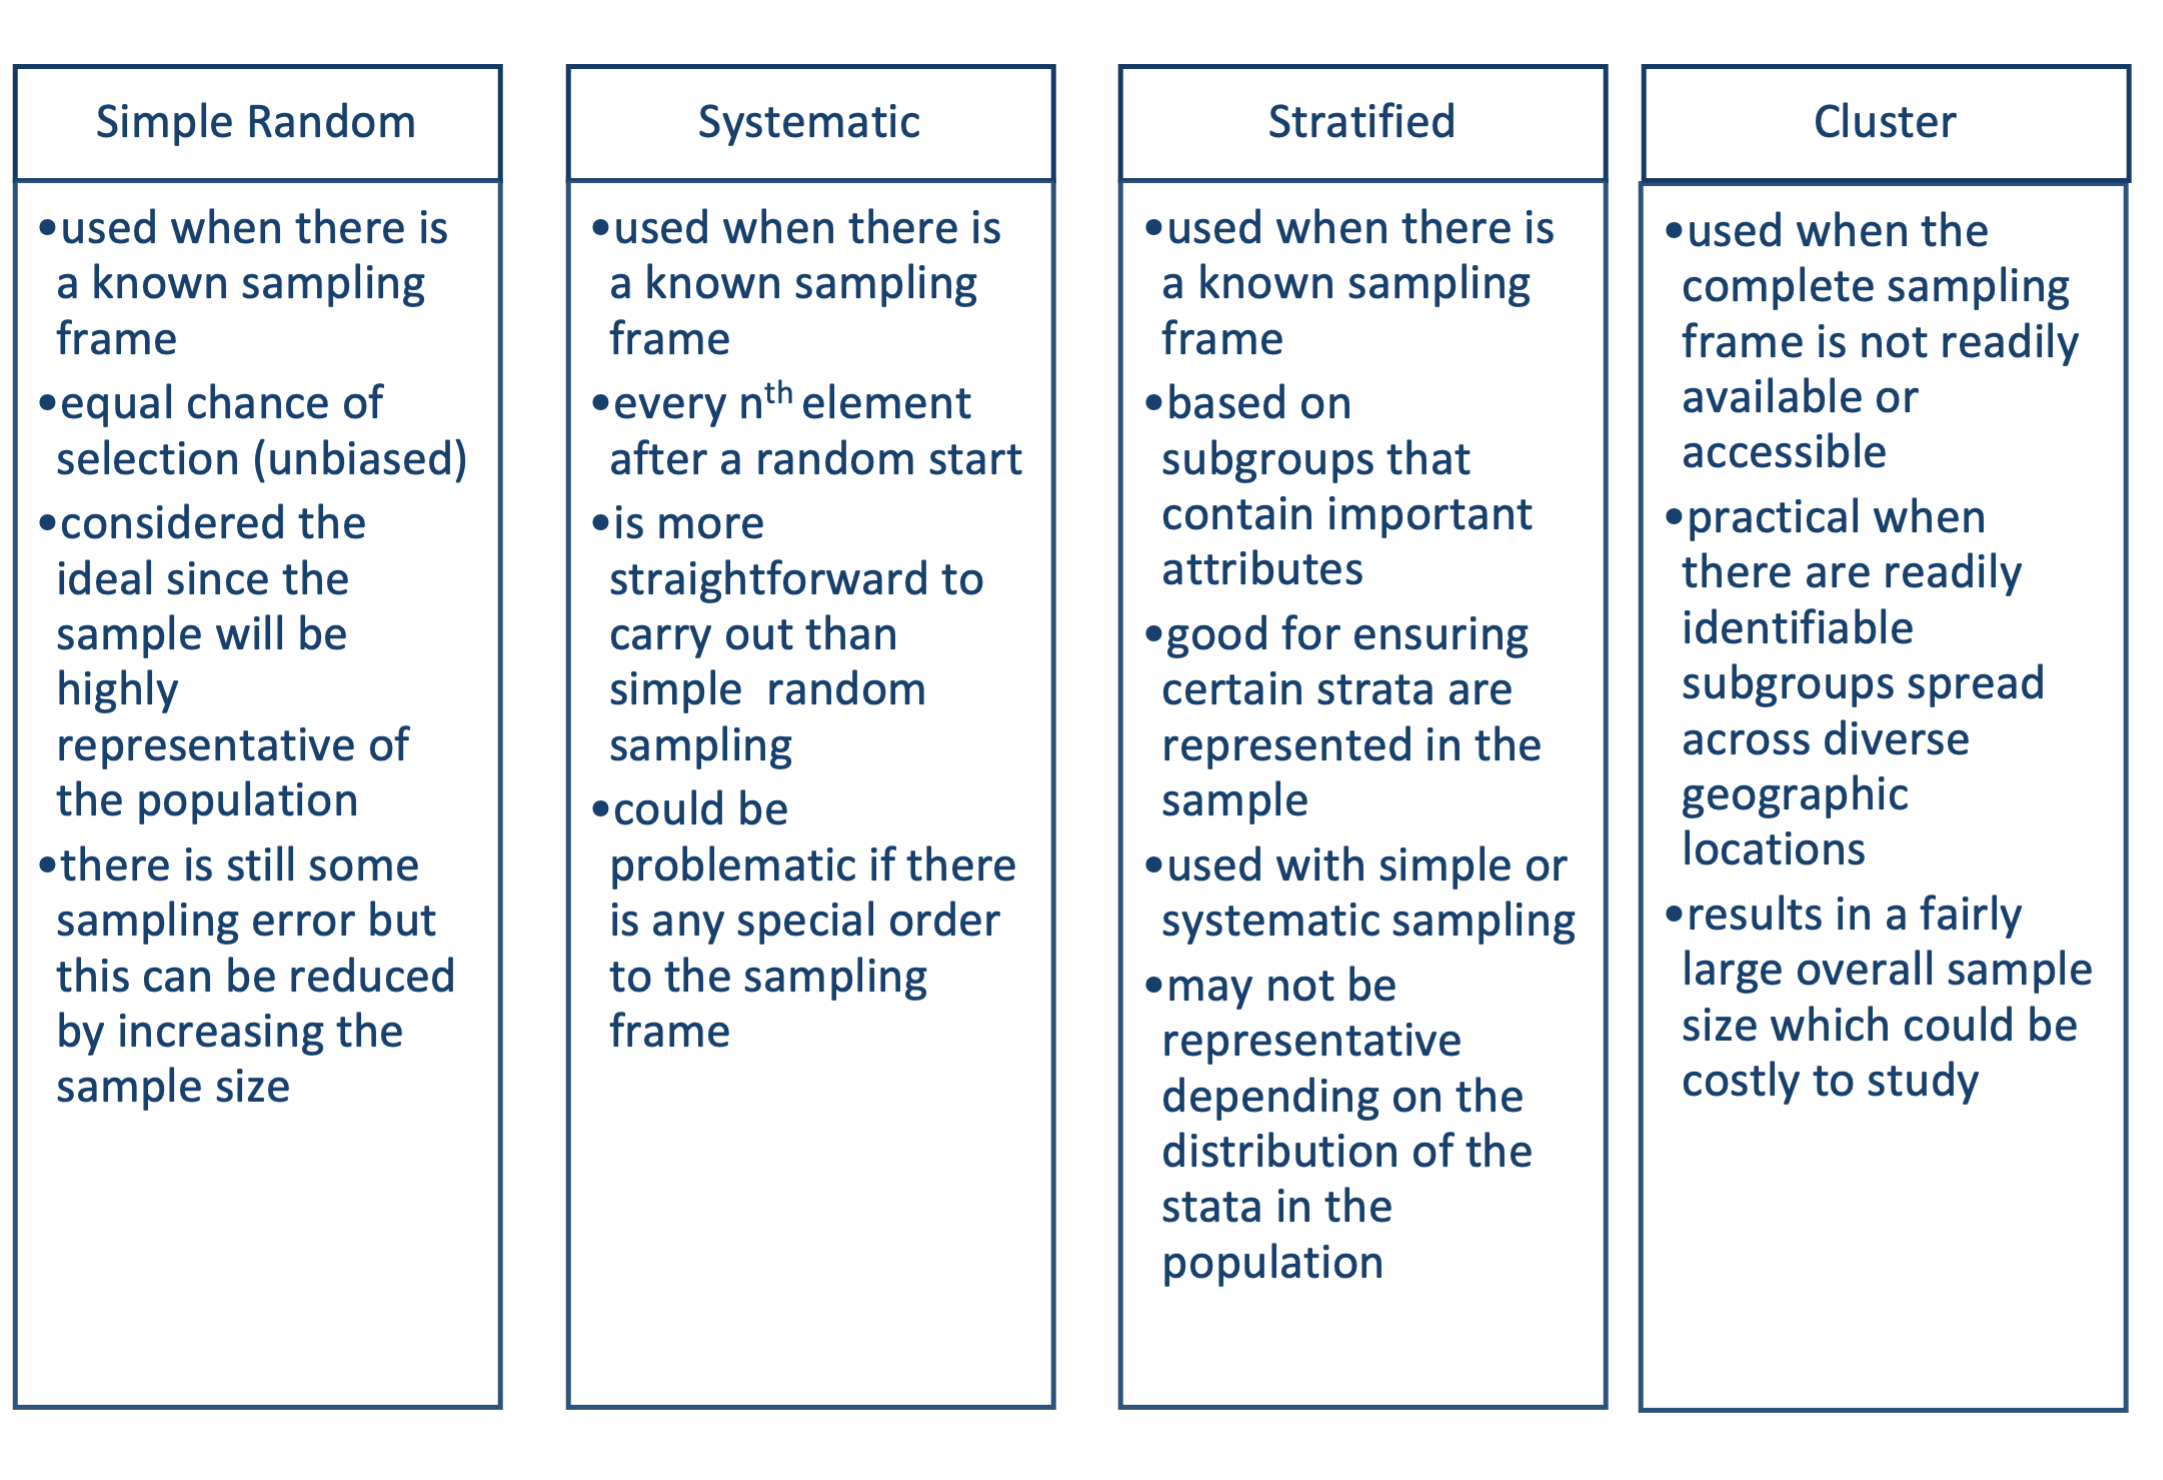
For example, a researcher wishing to interview people about their summer vacation spots by lakes in Alberta would be unable to obtain a complete sampling frame of individuals with campers, trailers, or cabins near lakes in Alberta. Even if it were possible to create such a listing, it would not be feasible for a researcher to locate everyone in the vast area including Peace River, Grand Prairie, Hinton, Red Deer, Canmore, Jasper, Wainwright, and Lethbridge. Instead, the population of interest can be divided into mutually exclusive clusters based on geographic location. The 2023 Alberta Guide to Sportfishing Regulations divides Alberta lakes into 14 main geographic zones (Eastern Slopes 1; Eastern Slopes 2; Eastern Slopes 3; Eastern Slopes 4; Parkland-Prairie 1, etc.) (Sport Scene Publications, 2023). Within each of the 14 zones (or clusters), there are several lakes (e.g., Eastern Slopes 1 includes 159 lakes). A researcher can randomly sample one lake from each cluster and then attempt to conduct interviews with everyone in those 14 lake communities. If every person or instance from a cluster is included in the sample, the overall process is called “one-stage cluster sampling.” Even though the researcher in this example limited the study to only 14 lake communities, there might be several hundred lake dwellers within each community, resulting in a sample size into the tens of thousands. To decrease the sample size, a researcher might utilize random or systematic sampling within each lake community. For example, the researcher might randomly sample for 20 members within each of the lakes chosen, for a total sample size of 280. Further sampling within clusters is called “two-stage cluster sampling.” For an overview of the four probability-based sampling techniques, refer to figure 5.4.
Research in Action
Understanding Sampling
Should Frito-Lay accept a multitonne shipment of potatoes to make its next round of Lay’s potato chips? Learn why representative sampling is important for understanding a population of interest in Annenberg Learner’s “Against All Odds: Inside Statistics” video featured on the Census and Sampling page of their website.
Activity: Probability Sampling Techniques
Test Yourself
- When is probability sampling used in research?
- What is a sampling frame?
- Is sampling usually carried out with or without replacement in social research?
- Which sampling method is especially practical when subgroups are spread across diverse geographic locations?
- Which sampling method relies upon a fixed sampling interval?
ADVANTAGES AND DISADVANTAGES OF PROBABILITY SAMPLING
Representativeness
The biggest advantage of a probability-based sampling method is that the sample generated is a fair representation of the population of interest. This means information obtained from the sample, often in the form of opinions of respondents who complete a survey or provide answers during an interview, is generalizable to the larger population. As a result, when a sample of students expresses their desire for published instructor ratings, we can be reasonably assured that the points raised are relevant to the wider study body. For example, if students in the sample noted that they wanted ratings published so that they could be used in the selection of courses and instructors, we can be certain that most students would identify the same benefits stemming from the disclosure of student ratings of instruction (Howell & Symbaluk, 2001). A population that has very little variability, as is the case if members of a population hold similar views or have similar characteristics, is considered “homogenous.” The more homogenous a population is, the more confident we can be that a sample drawn from it represents that population. For example, if most students believe student ratings of instruction accurately measure teaching effectiveness, and most students support the public disclosure of ratings, then it doesn’t really matter if the sample contains 100 or 500 students, since their responses are likely to repeatedly express the same position. Alternatively, if there is variation in views toward student ratings of instruction, as is the case with instructors—where some consider student ratings to be valid measures of teaching excellence, while others perceive them to be biased measures of teaching that are highly influenced by things like grades or level of course difficulty—a larger sample of instructors would be necessary to ensure that the appropriate variation was similarly captured in the study.
Sampling Error and Sample Size
Although the overall purpose of using a probability-based sampling method is to obtain a sample that is representative of the population, a sample generally does not contain the exact same parameters as the population of interest. For example, imagine your methods class of 30 students constitutes a population and your teacher randomly selects five students from the class list. While the class or population average on a midterm might be 78 percent, with a range of marks from 48 percent to 100 percent, the average for a sample of only five students might be quite different, depending on the exact students selected. If one of the top students ends up in the sample, even if the remaining four are “average,” the mean for the sample is likely to be quite a bit higher than 78 percent. Similarly, if even just one student is quite a bit below average, the sample mean will be substantially lower than what exists for the population. The difference between the sample mean (x̅) and the population mean (µ) is called sampling error. When researchers rely upon a sample to tell them about a population, they account for the likely amount of error using what is called a confidence interval. A confidence interval is an estimated range that is likely to contain the true population value, based on the sample value. A confidence level tells you how sure you can be that the results obtained using the sample are accurate. For example, an analyst might report that a survey’s findings are accurate within 4 percentage points (the confidence interval) with 95 percent accuracy (the confidence level). If the survey found that 56 percent of the Canadians sampled support raising the Goods and Services Tax (GST) back to the pre-2006 level (i.e., from 5 percent to 7 percent), this means that the analyst is 95 percent sure between 52 percent and 60 percent of all Canadians support the tax change.
Research on the Net
What is sampling error?
To help you understand what sampling error is and how you can reduce it, we recommend this short YouTube video by Elon University Professor Kenneth Fernandez: What is sampling error?
One way to be more confident in the findings based on a sample (i.e., to reduce sampling error) is to increase the size of the sample used. That is, the larger the sample, the more confident we can be that it will contain the same features as the population. Clearly, selecting only two students from a methods class is less likely to give you an accurate sense of how 30 students are doing than if the sample contained 10 students. But does a larger sample always increase accuracy? In other words, how big is big enough? The needed sample size can be determined using a statistical formula based on probability theory, which accounts for the confidence level, the size of the confidence interval, and the population size.
Research on the Net
Sample Size Calculator
Calculator.net, a website run by IT professionals, contains a multitude of free calculator tools including a sample size calculator as a public service. Try it! Here you can determine the sample size you need for a representative sample by selecting a preferred confidence level, entering a confidence interval, and indicating the population size. For example, using a 95 percent confidence level and choosing an interval of 5 (to represent the number of percentage points we could be “off” the population mean), if we were using a sample of students’ views toward publishing instructor ratings at the University of Toronto, where the population is size 97,678, we would need a sample of size 383.
Test Yourself
- What is the main advantage of using probability-based sampling methods?
- What is sampling error?
- Why does increasing a sample size lead to improved accuracy?
NON-PROBABILITY SAMPLING
Thus far I have discussed techniques based on probability, or the known chance of being selected. All sampling that is not based on known probabilities is a form of non-probability sampling. In non-probability sampling, the likelihood of selection of an individual or element in the population is unknown. This is usually because the sampling frame cannot be readily identified, such as the opening example of homeless in Toronto. Members of many subgroups of interest to researchers are difficult to identify or locate, including survivors of natural disasters and people living in remote communities. Others may wish to avoid detection for any number of reasons, as might be the case for individuals who live in polygamous marriages where a person has two or more spouses but can only be legally married to one at a time. Those who are identifiable and willing to participate in a study are very important and relevant contributors to our understanding of the subgroup or community of interest. Four common non-probability sampling techniques are discussed in more detail here: convenience, snowball, purposive, and quota sampling.
Convenience Sampling
Convenience sampling is a non-probability method used to obtain individuals or cases that make up a sample based on availability. A newspaper reporter who is developing a story about a fire that is in an apartment building might ask anyone who is present outside the apartment building if they have any information on the fire. Similarly, a researcher interested in community responses to fire evacuations after a state of emergency is declared might interview anyone who can be reached from the community of interest. In both cases, the sample will not be representative of the entire population; however, the reporter is likely to find out something about the fire in the apartment building and learn about select resident concerns, just as the researcher will find out how some members of the community are faring following the fire-related evacuation. Convenience sampling is sometimes called “haphazard sampling” and “accidental sampling” due to the way the sample is obtained. However, I prefer convenience sampling since the other terms imply disorganized research practices. A research question or the characteristics of a population of interest may necessitate the use of a sample that was obtained based on its availability. In this sense, availability only means potential accessibility or obtainability, not an easy route to acquiring a sample.
Convenience sampling is often used in exploratory qualitative research where one group of interest is studied as a starting point for learning more about an area. For example, Globerman (1996) conducted a study to learn more about the motivations of family members caring for relatives with Alzheimer’s disease, a form of dementia. Specifically, she was interested in questions such as “How do in-laws take responsibility for their spouses’ parents?” To obtain the sample, Globerman sent a letter to family contacts for patients diagnosed with Alzheimer’s who were residing in the community and were registered with a geriatric psychiatric clinic. The letter of request specified that Globerman wanted to interview at least three members of the family, all of whom would need to be living within 60 miles of the city. Of the 60 requests she sent out, 38 families agreed to participate in the study. Although not generalizable to all Canadian caregivers of elderly family members with Alzheimer’s, Globerman (1996) identified various patterns of interaction that could be explored in future research, including one in which sons-in-law tended to act as “performers,” who helped out when needed or directed to do so by their wives, and daughters-in-law acted more as “directors,” taking more of the initiative to get things done.
Snowball Sampling
Another type of convenience sampling is snowball sampling. Snowball sampling, also called “chain sampling” and “referral sampling,” is a non-probability method used to obtain a sample based on one or two available cases, followed by referrals that come from the original cases. For example, a researcher identifies one person who is suitable for the study, and that individual refers the researcher to another suitable individual, usually based on shared group membership. The next recruited participant then introduces the researcher to other potential participants, who then provide additional contacts. The process continues until a large enough sample is secured, like how a snowball collects surrounding snow and grows larger as it is moved along.
This technique is often used by researchers studying deviant or “hidden” populations. For example, as part of a larger study on drug-using street-involved youth in Vancouver, British Columbia, Stoltz et al. (2007) identified associations between early forms of child abuse and later involvement in sex work. Clearly, a sampling frame for homeless youth who are drug addicts is non-existent. The starting point for such a sample is usually whoever can be obtained through a convenience strategy, in this case involving what the researchers refer to as “extensive street-based outreach.” Willing participants are eventually located and recruited into the study, often with the help of social workers or members of agencies that already have an established rapport with members of the hidden population. For example, outreach organizations provide free condoms and clean needles to homeless individuals to reduce the transmission of diseases, and through their interactions, workers come to know some of the individuals living on the street. The snowball aspect of sampling comes into play through efforts to get initial participants to recruit their drug-using homeless peers and friends into the study (Stoltz et al., 2007).
Purposive Sampling
Purposive sampling involves a combination of sampling techniques used to obtain all possible cases that possess elements or characteristics of interest to the researchers. For example, McIntyre et al. (2003) were interested in finding out why disadvantaged women in Canada had lower than required dietary intakes but their children did not. The researchers used purposive sampling to obtain a sample of mothers living in Atlantic Canada who were lone parents of at least two children and whose income was at or below Statistics Canada’s low-income cut-off. With this sampling technique, the goal is to obtain a certain type of sample using a combination of strategies. To locate as many cases as possible of the desired population, the researchers first developed community clusters based on geographical representation and community size (like cluster sampling). Then, within each cluster, the researchers tried to recruit participants via referrals from personnel working for parent resource centres, public health units, and community organizations who could identify low-income families headed by lone females (sampling by convenience). Finally, the researchers relied on snowball sampling to obtain additional participants once they had some initial recruits, until they achieved a final sample of 141 families. In case you are curious, results indicated that mothers’ dietary intakes were consistently poorer than their children’s. Further, the differences in dietary adequacy and intake between mothers and children widened as money for food dwindled, suggesting that mothers compromise their own nutritional needs to provide for their children (McIntyre et al., 2003).
Quota Sampling
Finally, quota sampling is a method in which cases are selected based on specified characteristics believed to represent the population of interest. Quota sampling is like stratified random sampling, except that the sampling frame is unknown. As a result, the population is not first divided into the groups or strata of interest, and the actual sampling method rests with the individual researcher. For example, a researcher might post an online survey, choose a sample size (e.g., 100), and then select for inclusion in the study the first 50 part-time instructors and the first 50 full-time instructors who complete the survey. While this method is an improvement over convenience sampling since an expected population characteristic is being replicated, the result still might bear little resemblance to the population of interest due to the non-random selection process. For example, what if the 50 part-time instructors are mostly from biology, while the 50 full-time instructors are from psychology? In this case, any differences found between the full- and part-time instructors might more accurately reflect differences in views based on the discipline of study rather than their employment status.
Activity: Non-Probability Sampling Techniques
Research in Action
RCMP Use Quota Sampling in Affirmative Action Hiring

To overcome disproportionate white male police officer prevalence in the workforce, the Royal Canadian Mounted Police (RCMP) endorses affirmative action practices in their recruitment of new officers. The underlying principle is that a modern and effective police force should be diverse and representative of the communities it serves (Royal Canadian Mounted Police, 2023). Using a method like quota sampling, certain members of the population are overemphasized in recruiting practices, including women, visible minorities, and First Nations, Inuit, and Métis. The RCMP also funds various initiatives to assist youth and underrepresented populations, including a Diverse and Inclusive Pre-Cadet Experience (DICE) Program aimed at removing systemic barriers to RCMP careers for racialized and underrepresented individuals (Shaw, 2023).
Test Yourself
- When might a researcher choose to use non-probability-based sampling?
- What is the main difference between convenience and snowball sampling?
- What does purposive sampling entail?
- Which non-probability sampling method is most like stratified random sampling?
ADVANTAGES AND DISADVANTAGES OF NON-PROBABILITY SAMPLING
Practicality
The main advantages of using non-probability-based sampling techniques include the fact that they are generally convenient and inexpensive, and are often efficient for getting access to a sample needed to carry out research on a topic of interest. Non-probability sampling is important because, from a practical standpoint, it can enable a researcher to carry out a study in cases where probability sampling is not possible. A population can be hidden or difficult to reach, as might be the case if a researcher is interested in illegal drug users, homeless individuals, HIV positive people, outlaw motorcycle gang members, street prostitutes, same-sex couples, families living in poverty, and/or individuals with an abusive family history. Non-probability sampling is especially effective for qualitative forms of exploratory research aimed at an in-depth understanding of small groups (Chambliss & Schutt, 2019).
Generalizability
One of the main challenges non-probability-based sampling poses is that the techniques produce samples that are not representative of the population. This means the findings generated by the sample, such as the responses given on a survey, answers provided during an interview, or observations made on the group, pertain only to that group. In addition, samples obtained through non-probability methods are prone to errors such as bias because they are not randomly selected. It is impossible to even ascertain how the sample is biased because it is unclear which characteristics of the population ended up or did not end up in the sample (Bouma et al., 2016). Think about what would happen if you only included your closest friends in a study on matters of interest to you. It is likely that you and your friends share common interests, such that any findings obtained from the sample will closely correspond to your personal views but not the views of other individuals in your class, your city, or your home province.
While it is true that qualitative research poses issues for generalizability, it is just as important to note that qualitative research is not conducted for this explicit purpose. Instead, qualitative researchers examine a specific group or process at a time and location to learn more about it or to explain what is going on in that setting. That is not to say the findings cannot extend beyond that group. Scott and Garner (2013) suggest it may be more appropriate to use the term relevance in place of generalizability. They use an example of a researcher who studies episodes of violence carried out by members of a gang and concludes that there is more violence enacted toward fellow gang members (intra-gang victimization) than against rival gang members (inter-gang violence). If the goal is to understand a more generic process, then “a study (or scientific story) of a specific set of gang members might not be generalizable to all gang members in all cities across the planet, but it might have relevance to the way many or most or a significant number of gangs operate” (Scott & Garner, 2013, p. 35). Similarly, Robert Yin (2018) argues that the logic that pertains to the kind of probability sampling discussed earlier on is suited to survey research but does not apply in the same way to case study designs. However, he also claims if it is possible to isolate what is happening in one case, then a researcher can later examine other cases to see if the findings extend. Yin (2018) calls this “replication logic,” more like experimental designs, where additional case studies are used to test theories developed in the initial one.
Test Yourself
- What type of population is especially suited for non-probability sampling methods?
- What is the main disadvantage of using a non-probability sampling technique?
- What is theoretical sampling?
THEORETICAL SAMPLING
In concluding this chapter, I want to note that sampling is not just a technique that is decided upon prior to beginning a study. In certain forms of qualitative research, sampling can be an ongoing process that occurs largely at the data collection and analysis stage. In fact, sampling can produce findings that prompt additional and even different sampling techniques. This special type of sampling, called theoretical sampling, is a concept-driven method for obtaining data used in qualitative research (Corbin & Strauss, 2015). Theoretical sampling occurs as data gathering processes uncover important concepts, which then dictate how subsequent data gathering will take place to develop the emerging theory (Corbin & Strauss, 2015). For example, while conducting interviews with Vietnam War veterans, Corbin noted that one participant (a nurse) identified the war experience as “not too bad,” leading the researcher to ask, “How come?” The vet indicated he was not a “combatant” (p. 138). The concept “combatant” then prompted the researchers to immediately seek out a combatant who might offer a different perspective on what the war experience was like. The second interviewee brought up the centrality of “survival” and a “lack of healing”—issues that were part of the combatant experience and were still evident more than 30 years after the original ordeal. These findings then prompted the researcher to read memoirs written by combatants for more information on the “war experience” that was shared by combatants, and the process continued to unfold from there (Corbin & Strauss, 2015, p. 138). In theoretical sampling, the population and its central features are not known in advance. Instead, the sampling criteria are defined or created with each new step involving data collection and analysis. The process ends once an in-depth exploration and understanding of the main concepts is achieved. This is called “theoretical saturation” (Corbin & Strauss, 2015; Flick, 2014). Table 5.1 summarizes the sampling methods.
| Probability | Non-probability | Theoretical |
|---|---|---|
|
|
|
Test Yourself
- What is theoretical sampling?
CHAPTER SUMMARY
- Define sampling and differentiate between a population and a sample.
Sampling is a technique used to acquire the unit of analysis from a population of interest. The sample is a subset of the population, which contains the complete set of individuals, scores, or objects of interest to the researcher. - Explain why a researcher might choose a probability-based sampling method and distinguish between simple random, systematic, stratified, and cluster sampling techniques.
A researcher will likely employ a probability-based sampling method when a representative sample is desired and when a sampling frame can be made available. Simple random sampling is used to obtain a sample based on chance. A random sample is usually obtained using a random numbers table after a sampling frame is identified. Systematic sampling is also based on probability, except the sample is selected based on a fixed interval. First, the sampling frame is identified, and then a sampling interval is determined. After randomly selecting the first case, every nth case is chosen after that until the desired sample size is reached. Stratified sampling relies upon known population characteristics of interest. A researcher divides the population into groups based on features such as age, employment status, or location and then randomly samples for a certain number of cases from each group. Finally, cluster sampling involves selected groups rather than individual cases, often to accommodate a population that is spread over a vast geographic area from which it is not feasible to randomly sample individual cases. For example, to obtain a sample of individuals living in remote communities, a researcher might first create a sampling frame of remote community clusters based on geographic area and then randomly select clusters that will be included in the sample. - Identify the main advantages and disadvantages of probability-based sampling techniques.
The advantage of probability-based techniques is that they produce representative samples that closely resemble populations of interest. This means generalizations or inferences can be more readily made from samples to populations of interest. However, since samples are not exact replicas of populations, generalizations need to be made with caution, as there are still differences that result from measurement error. Larger samples help to increase accuracy and confidence that the sample will contain the relevant population parameters. - Explain why a researcher might choose a non-probability-based sampling method and distinguish between convenience, snowball, purposive, and quota sampling techniques. Sometimes populations are hard to locate or are hidden, making it impossible to identify the needed sampling frame used in probability-based techniques. Convenience sampling is a non-probability method in which individuals (or cases) are selected based on availability. Snowball sampling is a non-probability method that begins with a few cases selected by convenience, followed by referrals resulting from the original cases. Purposive sampling involves a combination of techniques used to obtain all possible cases that possess characteristics of interest to researchers. Finally, quota sampling is a method in which certain individuals are selected to try and replicate characteristics that are known to exist in the population of interest.
- Identify the main advantages and disadvantages of non-probability-based techniques.
Overall, non-probability sampling methods are practical in many cases, as they are less costly and less time consuming than probability-based techniques. It is also not always possible or even desirable to use probability sampling. In some cases, a sampling frame is unknown and therefore a non-probability method must be employed to study a hidden or hard-to-reach population. The main disadvantage is that the sample is not representative of the population. This means findings are generally limited to the sample itself. - Explain how theoretical sampling differs from probability- and non-probability-based sampling techniques.
Theoretical sampling is a concept-driven method for obtaining data in qualitative research. Data collection and analysis sometimes uncovers important concepts that warrant further exploration in a process that leads to eventual theory development. To learn more about the concepts, additional research is necessary, which entails additional sampling methods to acquire new participants or cases. Since the sampling emerges out of data analysis, the population is not identified ahead of time, as is the case with probability-based techniques. There is also no prior intent to obtain a sample of a certain size or with certain features.
RESEARCH REFLECTION
- Think of a topic of interest that would be suitable to examine if students at your university constituted the population under investigation. Write three questions that would help you learn more about your topic of interest. Interview a couple of students in class to obtain information on your topic. Did the sample of students you talked to make up a suitable sample? Why or why not? Given your specific topic and interests, which sampling method would be ideal? Defend your answer.
- Identify a practice in everyday life that involves simple random sampling. Explain your answer.
- Suppose your post-secondary institution has 2,400 instructors. The president decides to systematically sample 200 instructors for suggestions on how to improve office space and working conditions.
- What would be the sampling interval?
- If the number 6 was randomly drawn for a starting point, what would be the next five numbers for inclusion in the sample?
LEARNING THROUGH PRACTICE
Objective: To review sampling concepts in an applied context
Directions:
- Go to Statistics Canada’s 2023 Survey on COVID-19 and Mental Health (SCMH).
- Locate the survey’s information on “Data sources and methodology.” Read the description of the target population, instrument design, and sampling sections to answer the following questions:
- Who is the target population?
- Was a probability- or non-probability-based sampling method used?
- Which specific sampling technique was used?
- What was the sample size?
- Why do you suppose this sampling technique was utilized?
- What was the response rate for this survey?
RESEARCH RESOURCES
- For an overview of sampling in a wide variety of contexts (e.g., social sciences, business, and health), see Lohr, S. L. (2022). Sampling: Design and analysis (3rd ed.). CRC Press.
- To learn about food insecurity among Canadian youth, see Dubelt-Moroz, A. et al., (2022). Food insecurity, dietary intakes, and eating behaviors in a convenience sample of Toronto youth. Children, 9(8), 1119-1131.
- For a detailed discussion on theoretical sampling, refer to chapter 7 in Corbin, J., and Strauss, A. (2015). Basics of qualitative research (4th ed.). Sage.
- To consider issues related to the use of convenience and purposive samples, see Andrade’s (2021) article: The inconvenient truth about convenience and purposive samples. Indian Journal of Psychological Medicine, 43(1), 86–88.
The technique or process used to acquire the unit of analysis from a population of interest.
The total collection of all cases in which the researcher is interested and that [they wish] to understand better.
A subset of the population of interest that comprises the unit of analysis in a study.
A method in which every individual or element in the population has a known chance of being selected.
A method in which the chance of selection of an individual or element in the population is unknown.
A sample with the same aggregate characteristics as the population from which it was selected.
The complete list of individuals or elements making up the population.
A probability-based method used to obtain individuals or cases that make up a sample, based on chance alone.
A probability-based method used to obtain a sample based on a fixed interval representing every nth case listed.
The fixed interval used to select every nth case listed after a random starting point is obtained.
A probability-based method used to obtain a sample, based on known population characteristics.
A sampling method used deliberately to obtain a different ratio of relevant characteristics than what exists in the population.
A probability-based method for selecting groups for a sample, based on their geographic location.
The difference between the sample statistic and the population parameter.
An estimated range that is likely to contain the true population value based on the sample value.
A non-probability method used to obtain a sample based on availability.
A non-probability method used to obtain a sample based on one available case, followed by associated referrals.
A non-probability method in which a researcher uses a combination of techniques to obtain all possible cases that possess the desired characteristics of the population of interest.
A non-probability method used to obtain a similar proportion of some characteristic of interest in a sample as exists in the population.
A concept-driven method for obtaining data used in qualitative research.
