Chapter 7: Surveys
Users of surveys require solid, reliable data. The cliché “garbage in, garbage out” applies to surveys. If a survey contains the wrong questions, good decisions cannot be based on the information.
— George Gray & Neil Guppy, 1994, p. 7
Learning Objectives
After reading this chapter, students should be able to do the following:
- Describe the purpose of a survey and the kinds of questions asked using surveys.
- Explain why research objectives need to be clarified prior to the onset of research.
- Outline key methodological considerations that precede survey research.
- Compare and contrast questionnaires and interviews.
- Identify recommended “dos” and “don’ts” in the construction of surveys.
INTRODUCTION
From customer satisfaction surveys to public opinion polls to market research, a wealth of information can be obtained by asking questions. Surveys outnumber other data collection methods in the leading journals of various disciplines, including economics, sociology, political science, and social psychology (Saris & Gallhofer, 2014). “Surveys are information collection methods used to describe, compare, or explain individual and societal knowledge, feelings, values, preferences, and behaviour” (Fink, 2017, p. 2). Statistics Canada’s census surveys the entire population to describe Canadians by asking questions on housing (e.g., whether people rent versus own their own dwelling), personal attributes (e.g., age and marital status), and economic characteristics (e.g., yearly income and employment status), among other topics (Statistics Canada, 2024b). Because the data is collected every five years, comparisons can be made to gauge trends over time, such as population growth or changes to the employment rate. Census data is also grouped so we can note, for example, the percentage of those 14 years of age and under, 15 to 64 years, and 65 years of age and older for Canada, as well as within and between provinces and territories.
THE PURPOSE OF SURVEYS
Simply put, the purpose of a survey is to find things out by asking questions. Researchers use survey methods to describe individuals and groups and to learn more about their existing knowledge, their thoughts and feelings about certain issues, and their actions—what they do, why they do it, or how they are likely to behave under specific circumstances. Similarly, surveys are routinely employed by psychologists, social workers, and healthcare professionals in the identification, assessment, and treatment of people for various conditions and disorders, such as anxiety, depression, attention deficit, drug abuse, and anger management. Importantly, survey methods enable researchers to describe populations and examine relationships among and between variables of interest.

Asking Questions
One of the more common types of information collected through surveys is demographic. Demographic questions help describe a population by collecting “facts about a respondent’s age, race/ethnicity, education, job, gender, marital status, geographic place of residence, type of residence, size of family, and so on” (Fink, 2003, p. 79). Demographic information helps us better understand the population, and it can serve as an indicator for why people think or behave the way they do or why they experience events as they do. For example, we know that certain groups such as Indigenous peoples, single parents, children, individuals with work-limiting disabilities, unattached individuals aged 45 to 64, and recent immigrants are at greatest risk for poverty in Canada (Government of Canada, 2022).
In addition to demographic questions, most surveys include questions that measure knowledge, attitudes, and/or behaviours. Knowledge questions gauge whether respondents can retrieve and correctly report facts. Political knowledge, for example, can be assessed through questions pertaining to respondents’ understanding of election procedures and the rights and responsibilities of Canadian citizens, Canada’s social and cultural history, and/or Canada’s political system (Government of Canada, 2024). In an Institute for Research on Public Policy survey conducted in 2006, Henry Milner found that Canadians were lacking in their knowledge of politics and government. A series of questions were used to assess political knowledge, including one in which respondents were asked, “Which of the following best describes who is entitled to vote in federal elections?” Response options included the fixed categories “residents,” “taxpayers,” “legal residents,” “citizens,” and “don’t know.” Respondents were also asked open-ended questions, including “Please name two members of the Federal Cabinet and identify the department they are in charge of.” Results for seven main questions assessing political knowledge showed that the average number correct for Canadians was 2.57 for those aged 15 to 25 and 2.93 for those 26 years of age and older. Only 33 percent correctly named one cabinet minister (Milner, 2007). Stockemer and Rocher’s (2017) more recent analysis of electorate survey data attributes decreasing political knowledge to declining levels of voter turnout among younger Canadians over time. The generational gap in political participation is explained in part by the differences in how younger and older Canadians consume media. Younger Canadians are more apt to use social media, trust experts, and perceive government and politics to be too complicated for them to understand compared to older Canadians, who are less likely to use social media or trust experts, and more likely to watch a lot of news and have a higher rate of political interest (St-Jean, 2023).
Attitude questions measure respondents’ views toward a person, event, institution, or whatever the attitude object happens to be, such as “Are you in favour of abortion?”; “Do you consider yourself to be healthy?”; or “Is your instructor effective?” Attitudes are believed to consist of cognitive, affective, and behavioural components (Aronson et al., 2021). The cognitive component has to do with what people think about the attitude object (e.g., “I think that political candidate is honest”). The affective component has to do with one’s feelings toward the object (e.g., “I like that political candidate”), and the behavioural component involves a person’s intended actions based on the attitude (e.g., “I plan to vote for that candidate”). Surveys are also used to compare the attitudes and opinions of various subgroups. For example, are students in business as satisfied with their educational outcomes as students who are in health and community studies, and if not, why might this be the case?
Finally, behaviour questions ask about respondents’ actions or experiences and they are typically stated with reference to “time, duration, or frequency” (Fink, 2003, p. 71). For example, “Which of the following radio stations do you usually listen to?”; “How often do you eat out at restaurants?”; “When was the last time you had a physical examination by a medical doctor?”; or “In the last year, have you been a victim of an identity theft?” Behaviour questions often measure the central constructs or dependent variables (i.e., outcomes) in a study. For example, researchers might examine whether respondents act a certain way or experience certain events because of other characteristics they possess, such as demographic variables or attitude measures that serve as independent variables (i.e., the presumed causes). Figuring out what type of questions to include and which constructs need to be measured in a survey becomes possible only after a researcher has clarified the overall purpose of the study.
Activity: Introduction to Surveys
Research on the Net
The Confederation of Tomorrow Surveys
The Confederation of Tomorrow surveys are carried out annually by an association of public policy organizations including: the Environics Institute for Survey Research, the Canada West Foundation, the Centre D’Analyse Politique – Constitution et Fédéralisme, the Institute for Research on Public Policy, the Brian Mulroney Institute of Government, and the Johnson Shoyama Graduate School of Public Policy. The annual surveys are aimed at helping Canadians and government make informed public policy decisions. A 2021 survey about Indigenous relations and reconciliation carried out with 5814 respondents, including 775 individuals who self-identified as Indigenous, showed that people in Canada are divided in their views on the current state of relations between Indigenous Peoples and non-Indigenous people. When asked: “Would you describe the current relations between Indigenous Peoples and non-Indigenous people in Canada today as very positive, somewhat positive, somewhat negative, or very negative” close to half (48%) described the relationship as negative (with 38% saying somewhat negative and 10% reporting very negative). Fewer respondents said the relationship was somewhat positive (32%) or very positive (6%), while 14% did not say.
Test Yourself
- What is the purpose of a survey?
- What are the main types of questions typically included in surveys?
PREPARING FOR SURVEY RESEARCH
The first step in any survey project is clarifying the research objectives. The research objectives are the underlying aims of the study, or what the study is about. The objectives provide direction for how to create the questions that will provide the relevant information on the topic of interest. Otherwise, as noted in the opening quote, a researcher may ask questions that are the wrong ones, making the data meaningless. Guppy and Gray (2008, p. 13) offer five essentials questions a researcher can ask to help clarify a study’s objectives before designing or beginning to carry out a study:
- What needs to be known?
- Why does it need to be known?
- What else needs to be known? Why?
- What will the results of the survey accomplish? What decisions will be based on the results of the survey?
- Is a survey the best method?
Once the research objectives are clarified and a survey method is decided upon, a researcher can begin designing a survey instrument to collect the information to answer the main research question of interest. However, several decisions still need to be made and various steps will need to be followed before a survey gets to the data collection stage.
Methodological Considerations
In addition to clarifying the main research question, a researcher also needs to decide whether to employ a longitudinal or cross-sectional design, which sampling method is most appropriate, who or what will comprise the units of analysis, and how the central variables are to be measured. In other words, how should the researcher design survey questions that will produce the relevant answers given the overall purpose and more specific objectives of the study? In addition, a researcher needs to determine if the survey will be administered using a questionnaire or interview format, how relevant ethical concerns will be addressed, and the best means for administering the survey (i.e., in person, by mail, over the internet, or by phone).
Choosing a Design
In chapter 4, you learned that some studies are conducted at a single point in time, while others take place at multiple points over time. Survey researchers are likely to choose a cross-sectional design when they are interested in describing a phenomenon of interest as it currently exists. For example, a researcher might want to know how Canadians feel about the oil sands mining projects being carried out in Fort McMurray, Alberta. A cross-sectional design is especially suitable for revealing differences in views based on respondent attributes such as occupation, educational level, ethnicity, political affiliation, and/or the province a respondent resides in.
In contrast, a researcher is likely to choose a longitudinal design for studies concerned with changes in variables of interest over time. For example, do people’s views toward the Athabasca oil sands mining projects change after learning about the greenhouse emissions and the destruction of ecosystems as identified by environmentalists? Using a longitudinal design, a researcher could measure views before and after exposure to environmental campaigns to see if attitudes change. Note that this follows the same logic as experimental designs with a pre-test and post-test measure, enabling researchers to identify influences on attitudes and explain how and why they change over time.
Sampling Considerations
After settling on the time dimension for the design, a researcher also needs to consider which of the sampling techniques discussed in chapter 5 is most suitable for obtaining an appropriate sample. Remember that if one of the aims is to have a sample that is representative of the larger population from which it was drawn, then a probability-based method such as simple random sampling is likely to be employed. However, if the sampling frame cannot be readily identified or certain characteristics of the population are of interest, then a researcher is more apt to rely on one of the non-probability sampling techniques, such as purposive sampling. While survey research is most often associated with the quantitative realm and an aim of describing a population of interest with a representative sample using statistical or numerical terms such as percentages, qualitative surveys do exist and are used to examine diversity in a population through more open-ended questioning (Jansen, 2010).
Finally, a researcher needs to consider the size of the sample to be included in the survey. Time and cost permitting, a quantitative researcher may wish to include a large sample to maximize generalizability while minimizing error. For example, a sample of 28,567 respondents was included in Canadian Survey conducted in 2017-2018 and 2018-2019 to examine the relationship between physical activity and mental health among youth (Buchan et al., 2021). In contrast, a relatively small sample might be enough for certain research purposes. For example, de la Salle et al. (2022) surveyed 66 peoples living in Canada and the United states who self-identified as Indigenous to learn about the feasibility of psychedelic use for reducing symptoms of stress and trauma. In this case, the sample consisted of a small group of Turtle Island’s Indigenous peoples who have experienced oppression and discrimination and who had previously taken naturalistic forms of psychedelic substances.
Note that a preferred sample size does not in any way guarantee the size of, or even the quality of, the sample that ends up taking part in the study. The rate of response for a survey refers to “the percentage of those sampled for whom data are actually collected” (Fowler, 2014, p. 6). The rate of response is calculated by dividing the number of completed questionnaires (or interviews) by the intended sample size (i.e., those initially targeted for inclusion). In general, the higher the response rate, the more likely the respondent sample will be representative of the population. However, perfect response rates are unlikely, and even what is considered a “good” response rate is dropping all the time as individuals become more difficult to locate (e.g., lots of people have a mobile phone but no land line) and even if reached are often unwilling to participate. This is partly because potential respondents are becoming increasingly mistrustful of surveys—particularly ones conducted over the phone—due to the prevalence of computer-generated telemarketing efforts and unsolicited telephone requests involving identity theft and fraud scams. As a rule of thumb, a response rate of at least 50 percent is deemed adequate for analysis and reporting, one that is 60 percent is good, and one that is 70 percent or higher can be considered very good (Babbie, 1990). While most methods textbooks indicate a desired response rate of 50-80 percent, current research suggests that lower response rates are not necessarily detrimental to research as they may have little overall impact on relationships among variables (Beehr et al., 2024).
Measurement Errors
In addition to design and sampling considerations, a researcher needs to be mindful of errors that can affect the reliability and validity of the information obtained by a survey. Groves (1989) identifies the following four main types of errors that pose problems for survey research: coverage error, sampling error, non-response error, and measurement error.
- Coverage error: Coverage error “occurs when the list from which sample members are drawn does not accurately represent the population on the characteristic(s) one wants to estimate with the survey data (whether a voter preference, a demographic characteristic, or something else)” (Dillman et al., 2014, p. 3). For example, coverage error occurs when researchers surveying Canadians interview residents of the 10 provinces and exclude those living in the three territories. Coverage error can also be a problem if a sampling frame is constructed from a telephone directory, since it will not include residents with cellphones but no land line, those who have unlisted telephone numbers, and people who have moved recently or recently acquired a telephone listing.
- Sampling error: As described in chapter 5, sampling error is the difference between the sample statistic and population parameter. Generally speaking, the larger the sample size, the lower the sampling error, or the better a sample statistic will approximate the true population value.
- Non-response error: Non-response error results from inaccuracies stemming from a failure to get everyone sampled to complete the survey as intended. Specifically, non-response error “is the difference between the estimate produced when only some of the sampled units respond compared to when all of them respond. It occurs when those who do not respond are different from those do respond in a way that influences the estimate” (Dillman et al., 2014, p. 3). To try and minimize this, survey researchers may employ strategies to increase overall response rates, including the use of reminders, personalized contacts, and various incentives (Smyth & Pearson, 2011).
- Measurement error: Systematic errors in measurement occur when a questionnaire contains poorly worded instructions, questions, and/or response categories. For example, suppose a survey on criminal activity includes items that ask respondents how often they have done something, such as carry a concealed weapon or steal from a department store. If the response options are “never,” “two to three times,” and “more than three times,” someone who has carried out an act only once will either leave that item blank, resulting in a missing response, or provide an inaccurate response. In this case, the respondent is much more likely to choose zero since there is a greater tendency for respondents to skew estimates of infrequent behaviours toward zero (Bradburn et al., 2004). This is highly problematic since respondents who commit a criminal offence once are likely to be different than respondents who never commit the act.
Test Yourself
- Why is a cross-sectional design especially suitable for survey research?
- How is the rate of response for a survey calculated?
- What are the four main types of errors that pose problems for survey research?
SURVEY METHODS
Quantitative researchers use two main survey methods: questionnaires and structured interviews. A questionnaire is a survey data collection tool in the form of a series of questions, items, and/or prompts to which a respondent provides the information of interest to the researcher. A respondent may complete the instrument entirely on their own, called a self-administered questionnaire, or may complete an assisted questionnaire, where a researcher or other trained staff member guides the respondent through it. The questionnaire itself can be in hard-copy (paper) format or, if it is administered online, it can be in a soft-copy (screen image) that is accessed using a survey software program. Surveys can also take the form of highly structured survey interviews where respondents answer a series of prescribed (i.e., prearranged) questions posed directly by researchers or trained research assistants who record the responses. This can be done in person, over the telephone, or as an email exchange. Note that interviews can also be open ended, unstructured, and highly intensive. These are designed to allow the researchers to learn more about events from the perspective of participants. Such interviews are discussed in detail in chapter 9 on qualitative interviewing. This chapter is dedicated to the more quantitative forms.

Surveys are popular methods for describing groups of interest and finding out more about their knowledge, attitudes, and behaviours. As a method, surveys are an efficient means for collecting a huge amount of information from large samples. Every question is potentially a different variable, except in the case of indexes and scales where multiple questions measure the same construct. This means researchers can examine relationships among variables and look at numerous social issues at one time. Unfortunately, survey methods also raise validity concerns since responses are obtained from respondents who provide information that may not or may not be accurate. Respondents make mistakes, forget relevant information, distort information, and give false answers. As noted in an earlier chapter, a social desirability bias, for example, can prompt respondents to give “good” answers as opposed to accurate ones. There are also ethical concerns raised by survey data collection methods.
Ethical Concerns
All surveys pose ethical concerns. Respondents provide informed consent prior to participating in a survey based on a detailed description about the study, including information on the objectives and the type of questions they can expect to be asked. However, they need to be reminded that their participation is voluntary, they are free to refrain from answering any question, and they may withdraw altogether at any time without penalty. Asking questions of any nature can produce potentially harmful psychological outcomes for respondents, who may feel bad about characteristics they possess or about actions that they are being asked to report on. In addition, respondents may feel uneasy about providing information that is requested, particularly if it involves highly personal issues or deals with sensitive topics. Respondents may even become upset by what they learn about themselves after providing answers to the questions posed by researchers.
In addition to the ongoing potential for harm, anonymity can rarely be achieved in survey research. For example, in a face-to-face interview, the interviewer clearly knows who is providing the responses. Even for telephone, mail-out, or internet-based surveys, the number, address, or email account can be used by the researcher to identify the respondent. Identifying information is generally important only for sampling purposes. A researcher usually does not need to link up individual answers to the respondent who gave them and can, instead, code the responses under an assigned number (e.g., Respondent #1, #2) rather than an actual identity to help protect respondents’ privacy. Also, while anonymity cannot always be guaranteed, confidentiality usually can. A researcher can uphold confidentiality by never revealing identifying information publicly. A more detailed comparison of the specific data collection formats is provided next.

Face-to-Face Interviews
Prior to the 1960s, most quantitative surveys were conducted in person by an interviewer who usually visited respondents at their place of residence. One of the main advantages of this method is that sought-after potential respondents are highly likely to agree to participate in the study, producing high response rates. This is also beneficial for reducing response bias since all types of respondents are equally likely to participate at high rates (Czaja & Blair, 1996). In an in-person interview, a trained interviewer asks questions and the respondent provides answers, which are recorded by the interviewer. Skilled interviewers establish rapport and trust while remaining neutral, so they do not influence the respondents’ answers in any way. Interviewers carefully manage the conversation such that the respondent follows the instructions, does most of the talking, and provides appropriate answers to the questions of interest. Interviewers can assist in clarifying questions and explaining response categories to aid in the validity of responses obtained. In addition, interviewers can probe for responses and prompt respondents to provide additional details for increased accuracy in reporting. This also enables the researcher to explore topics in a bit more depth and complexity than is possible through a self-administered questionnaire.
While face-to-face interviews are still conducted today because they yield such high-quality data and they have the highest response rates of the survey methods, in-person surveys are rarely used for quantitative research purposes, largely due to their inherent drawbacks. Face-to-face interviews are the most expensive and time-consuming form of data collection (Czaja & Blair, 1996). Imagine interviewing 1,000 of 749,607 people living in the city of Winnipeg, Manitoba where there are 315,465 private dwellings, spanning an area of about 462 square kilometres (Statistics Canada, 2023d). It would take a very long time—likely more than 2,000 hours—for one researcher to complete the interviews. Even assuming the assistance of multiple trained interviewers who can conduct interviews simultaneously, if each interviewer conducted 50 interviews, the research project would require 20 interviewers. Each interviewer would need to travel to the location of their randomly assigned respondents and then spend an hour or so interviewing each person individually. Estimating a time of two hours per interview, including travel, at a rate of $25 per hour, each interviewer would be paid $2,500, amounting to $50,000 for data collection alone. And this was for a survey conducted only within the city of Winnipeg. A cross-national survey involving cities throughout Canada would be costlier and more time consuming.
In addition to cost, in-person surveys also run the risk of interviewer bias, an interviewer-based effect that can creep into a study in various subtle forms (Gray, 2022). First, despite efforts to remain neutral, how an interviewer behaves toward the respondent (intentionally or unintentionally) can affect that respondent’s willingness to answer any given question. In addition, the interviewer is the person asking the questions; therefore, how a question is asked might affect how it is interpreted and subsequently answered by the respondent. Also, how an actual response is recorded is determined by the interviewer, who may “interpret” responses in a manner that is more consistent with the interviewer’s own views than those of the respondent. While interviews pose many difficulties for quantitative researchers, they are especially beneficial to qualitative researchers seeking in-depth understanding with small samples (see chapter 9).
Mail-Out Questionnaires
Beginning in the 1960s and 1970s, researchers routinely mailed out questionnaires to intended respondents at their place of residence. A mail-out survey is a self-report questionnaire containing a series of items to be completed by the respondent and then sent back to the researcher. One main advantage of this method lies in its efficiency since researchers can send the questionnaires out at the same time, to be completed by respondents on their own, without having to pay interviewers. In a few short hours, envelopes can be filled, labelled, and stamped accordingly. Although they are less expensive overall when compared to interviews, there are still substantial costs associated with mail-out surveys. For example, mail-out survey costs are likely to include paper, questionnaire printing, envelopes, and postage at two or three times the usual rate since most questionnaires exceed the size and weight of a regular letter. These costs are incurred even for surveys that fail to be returned or are returned unopened due to inaccurate mailing addresses. To increase the likelihood that a respondent will return a completed questionnaire, it is practical to also include return postage with an envelope addressed to the researcher.
One of the main advantages of a mail-out questionnaire is the absence of the potential for interviewer bias. Another advantage afforded by the absence of an interviewer is anonymity. Respondents generally feel more comfortable and are therefore more inclined to answer sensitive questions and give accurate answers while completing a questionnaire alone than while being interviewed by a stranger (Fowler, 2014). Mail-out questionnaires can also include visual aids such as maps, charts, or other examples built into the design of the questionnaire. Visual aids help to explain instructions, can be used to illustrate points, and can provide additional guidance on how to answer questions using the response format provided for greater clarity and accuracy. In addition, respondents completing mail-out questionnaires can take the time to think about and even verify their answers before providing them.

As a disadvantage, mail-out questionnaires are easy to ignore or forget about, so they have a much lower rate of return than surveys involving some form of personal contact. Without additional follow-up, mail-out surveys are likely to yield a return rate of less than 50 percent (Heberlein & Baumgartner, 1978). Researchers relying on mail-out surveys, then, need to consider ways to increase response rates. Fowler (2014) notes that anything researchers can do to make a questionnaire appear more personalized, professional, and attractive will increase response rates. It is also important to make sure the questionnaire has very clear instructions and layout for how to complete it, is formatted in an attractive, easy-to read manner, and consists of relatively simple response tasks (Fowler, 2014). This means, where possible, it is better to use closed-ended questions where a respondent can readily choose an answer from a small number of selections rather than have them try to generate more effortful answers to open-ended items. Although open-ended responses are rich in detail, respondents will often leave open-ended questions blank (Dillman et al., 2014). In addition, the response categories need to be straightforward and easy to complete without making errors, such as use of large boxes the respondent can check off to indicate a choice or numbers that a respondent can easily circle as an answer. Aside from the design of the instrument, researchers can increase response rates with incentives provided in advance, such as an enclosed gift card, as well as mailed-out reminders sent out more than once to those who have failed to respond (Fowler, 2014).
Telephone Surveys
One way to retain most of the advantages of face-to-face interviews but reduce costs is by using telephone surveys. Gaining popularity in the 1980s and 1990s, telephone-based surveys are interviews conducted over the phone. Respondents are usually obtained using a sampling method called random digit dialing. Random digit dialing is a process where a computer randomly generates a sample of phone numbers from a sampling frame created using the assigned area codes for a given location. The interviewer can make calls to prospective respondents, or a computer can make the calls and transfer the call to an interviewer only if someone answers. Random digit dialing is still one of the most cost-effective and accurate way to obtain national population samples (Agans et al., 2021). Many phone surveys take the form of computer-assisted telephone interviews (CATI). In a CATI, the interviewer wears a headset and sits in front of a computer. The computer screen displays the question or item, which is read according to a script to the respondent. The respondent’s answers are then directly inputted as they are provided. Note that computer-assisted methods are also used in face-to-face interviews, called computer-assisted personal interviewing (CAPI). In this case, responses are input into laptops or mobile devices during the in-person interview (Dillman et al., 2014).

In a telephone survey, a trained interviewer reads questions to a respondent and records the answers provided. As in the case of in-person surveys, telephone interviewers can clarify instructions and questions for greater validity of responses. In addition, telephone surveys permit more anonymity than face-to-face interviews, which helps to increase the likelihood of providing truthful answers and decrease response bias, and it allows for the inclusion of more sensitive topics.
Telephone surveys are generally less time consuming and more cost efficient than in-person surveys. However, trust and credibility are difficult to establish over the phone. As a result, respondents are less inclined to participate in a telephone survey than one that is conducted face to face. It is also easier to ignore a phone call, especially when call display indicates an unrecognized phone number. Nonetheless, with repeated callbacks—which are relatively cost effective when using telephone surveys—response rates can eventually reach as high as 90 percent (Neuman & Robson, 2024). However, more and more people are opting for cellphones over land lines, and new technologies will continue to enable end-users to block and screen unwanted calls—including those from unknown sources such as computers—thereby limiting the future viability of phone surveys.
Research in Action
Researchers from the Department of Psychology at the University of Guelph, Ontario, and the Peel Regional Police Department in Brampton, Ontario, created an online survey to examine post-traumatic effects in policing. Of the 266 sworn officers who completed the survey, 76 reported experiencing at least one traumatic event at work within the last year. Of those who experienced trauma, distress disclosure was positively related to additional social support seeking and reduced impairment, while failing to disclose the event was associated with avoidant coping strategies and subsequent impairment (Pitel et al., 2021).
Internet Surveys
From 2000 to present, internet surveys have become an increasingly popular data collection tool. Internet surveys can be conducted in one of two ways: A respondent is sent a questionnaire as an email attachment to save, complete, and return, or more typically today, a respondent is asked to visit a website where a questionnaire is made available for completion (Dillmanet al., 2014). Various web-based companies offer survey support to individuals and organizations wishing to develop and administer online surveys. User-friendly templates make formatting and question construction relatively straightforward, even for novice researchers and those with less-than-ideal computer programming skills. For only a modest monthly fee for a software licence or subscription, internet surveys can be readily developed and sent out. Most everyone today has access to the internet, and respondents can reply almost immediately. Feedback provided to open-ended questions on internet surveys is much more detailed than what is given through more traditional data collection formats (Dillman et al., 2014). Moreover, the results for closed-ended items are often tabulated with the software program, making this the most efficient and inexpensive form of survey data collection compared to the other methods that require ever-increasing expenses related to travel, postage, printing, and/or long-distance telephone bills, followed by data coding, data entering, data analysis, and then data interpretation.
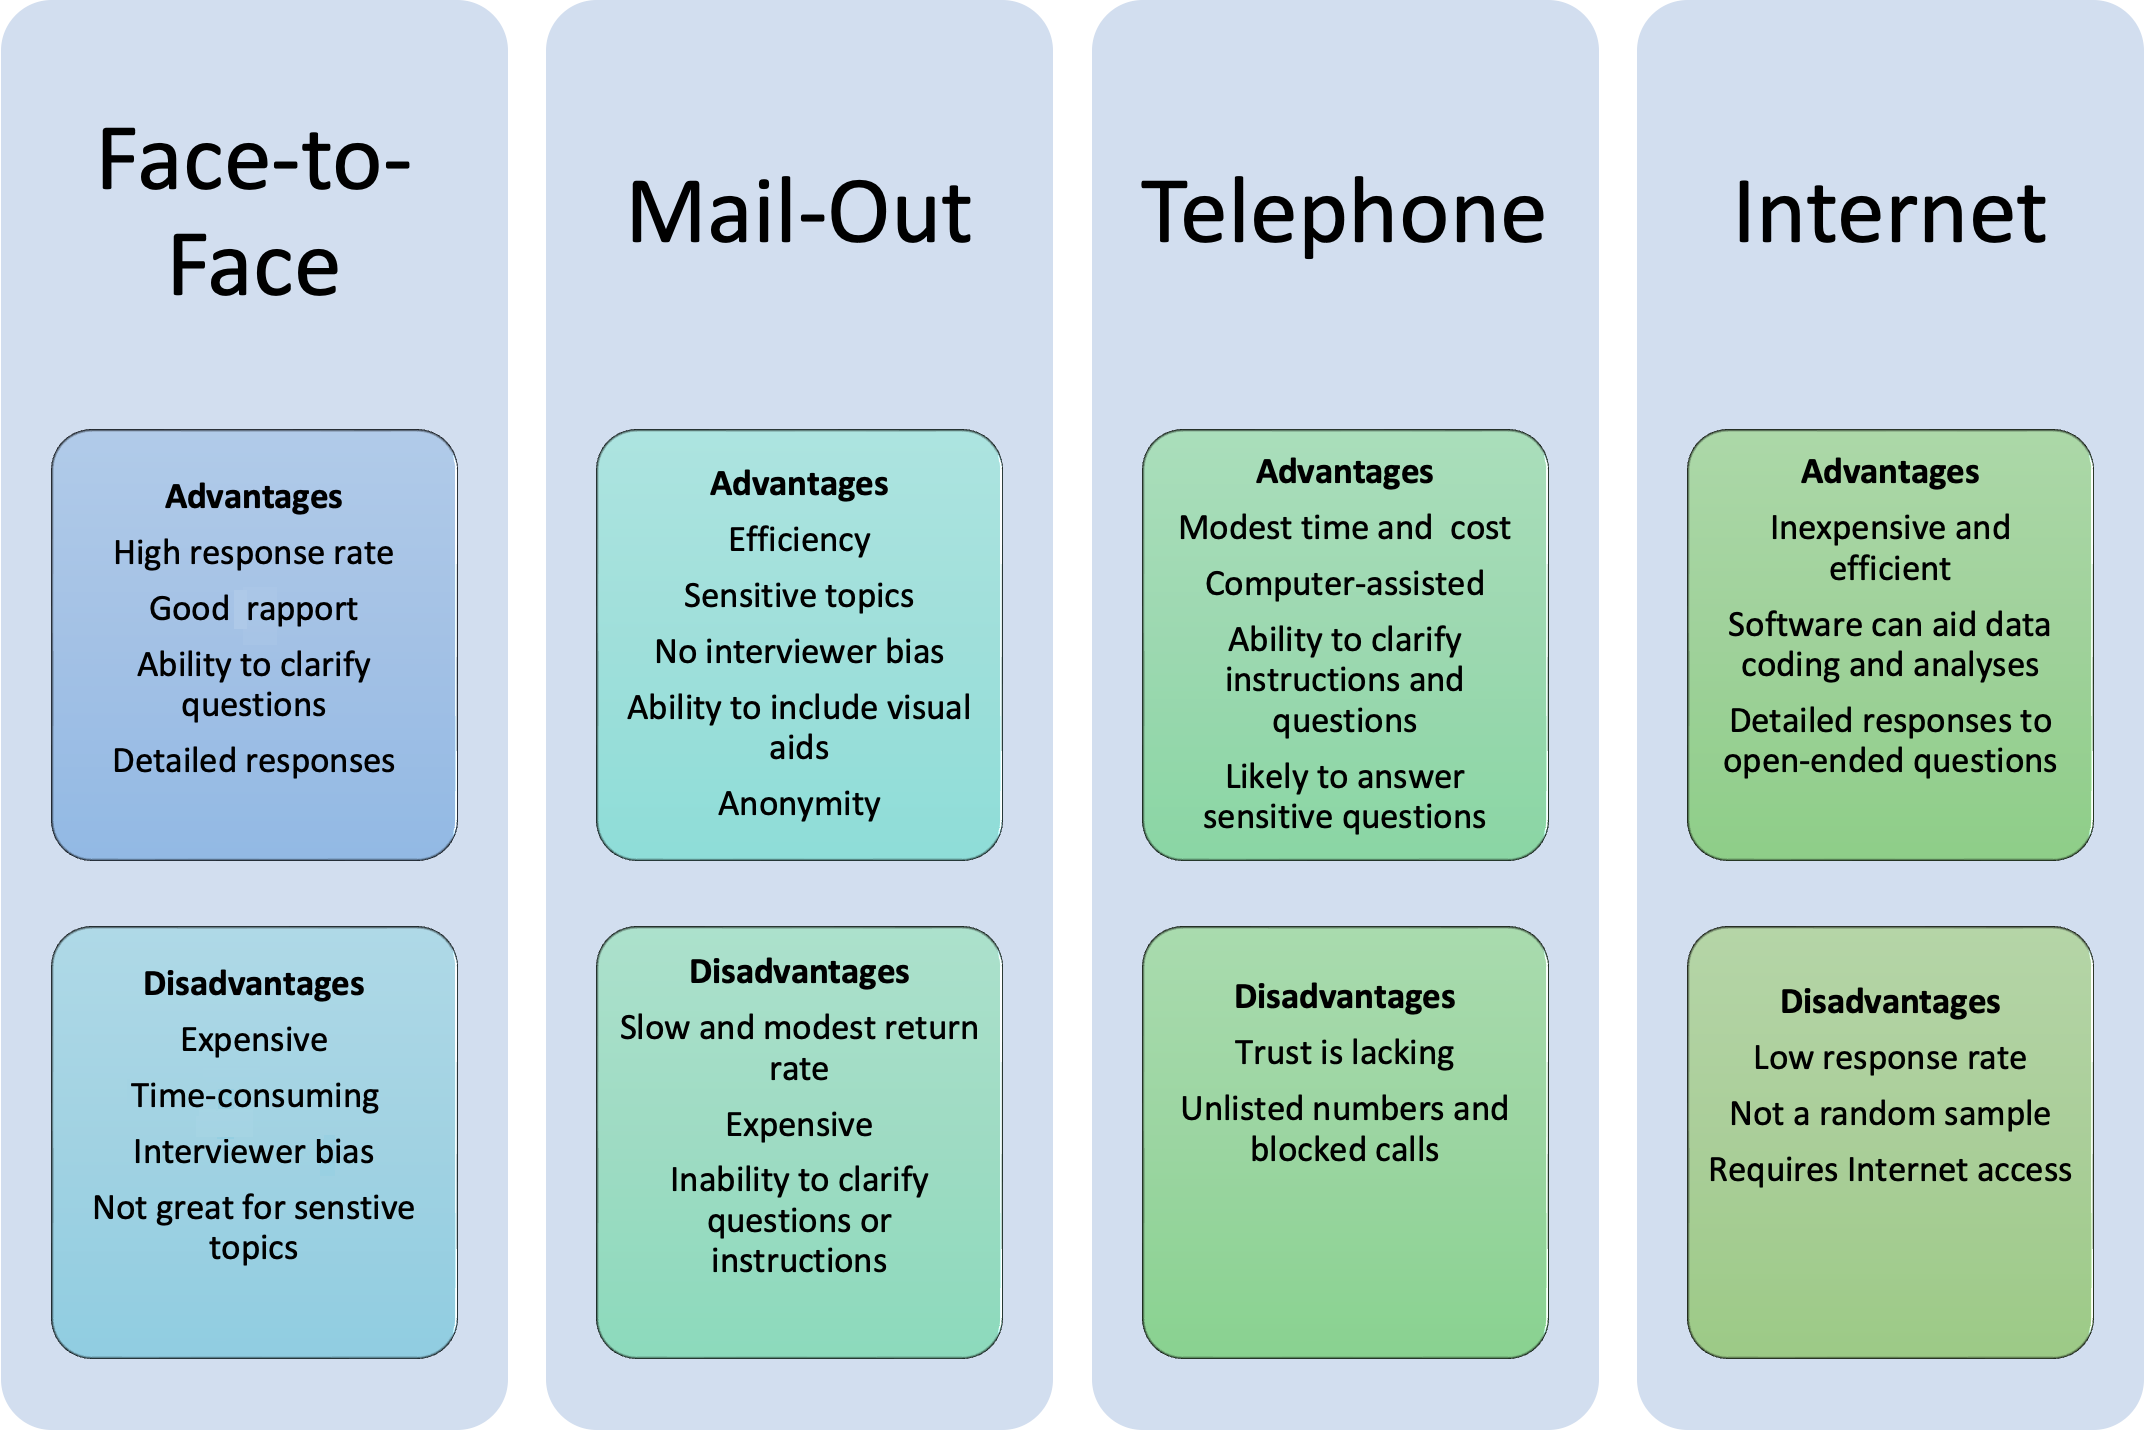
Unfortunately, the many advantages are overshadowed by some of the drawbacks. One of biggest drawbacks unique to this form of survey is the lack of a random sample. The people who choose to complete an internet survey are generally not determined from a sampling frame, and even in cases where they are, those who respond are not likely to constitute a representative sample, due to high rates of non-response. Internet surveys have the greatest variance in response rate. Some studies obtain a very low response rate, while others can secure a modest rate. They also have a lower overall rate of response compared to the other data collection methods (Smyth & Pearson, 2011). Given the lack of personal contact and connection, internet surveys are the easiest to delete or otherwise ignore. Dillman et al. (2014) recommend using highly tailored internet survey approaches that increase response rates through a careful consideration of all aspects of the survey process, from the targeted sample to the form of initial contact, to the benefits of participation, to the sampling procedures, as well as the many features of the questionnaire design. For a summary of the advantages and disadvantages of survey methods, see figure 7.1.
Test Yourself
- What is the overarching limitation of data collected from survey respondents?
- Under what circumstances might it be preferable to use a self-report questionnaire rather than a face-to-face interview?
- Which of the survey data collection methods produces the highest response rate?
Research on the Net
SurveyMonkey
One of the more well-established survey software programs is provided by SurveyMonkey, an internet-based company. The program helps users create their own surveys, such as Facebook surveys or telephone surveys, using a variety of question formats, such as multiple choice, open-ended, and so on. SurveyMonkey also provides support for data collection and analysis. At the home page for the site, you can find all kinds of survey templates (e.g., customer satisfaction surveys, market research surveys, student feedback) that will help you design survey questions. While you can create good questions with this software, there are some limitations to how you can ask certain types of questions and how you can set up the response formats.
SURVEY CONSTRUCTION
A survey is only as good as the questions asked. Keeping in mind the overall purpose and objectives of the study, a researcher aims to develop valid and reliable measures of the sought-after concepts or constructs. While the exact wording of questions will differ from survey to survey, good questions are “clear, short, unbiased, [current], and relevant to the target respondents” (Ritter & Sue, 2007, p. 29). In addition, effective surveys avoid the pitfalls associated with the use of double-barrelled items, negative questions, technical terms, and jargon. This section discusses established practices that can be considered the essential “dos” and “don’ts” of survey construction, including aspects of question wording, response formats, and design layout.
Question Wording
Be Clear
First, and foremost, the questions need to be clear so that respondents readily understand what is being asked of them. If the goal is to find out what students think of courses and instructors, the evaluation tool should include items focused specifically on aspects of the course, such as course content, assignments and tests, and level of difficulty, as well as aspects of the instructor, such as communication style, clarity, and knowledge. One way to help make the objectives of questions clear is to state items in complete sentence form. For example, course evaluation surveys prompt students to rate their level of agreement with statements, such as “The course met my learning objectives” and “Overall, my instructor was effective.” Note that an item such as “office hours” on its own is vague and therefore inadequately worded since respondents cannot tell whether they are being asked to comment on whether there were office hours, whether the office hours attended were helpful, or something else entirely. A much better item, stated in a complete sentence, makes the point clear: “My instructor was available during regularly scheduled office hours.”
Another way to make questions clear is to define central concepts and constructs so that respondents similarly interpret items as intended before they provide an answer. For example, rating “health” can entail aspects of well-being (e.g., perceived mental health, perceived life stress), health conditions (e.g., mood disorders, asthma, cancer incidence), as well as non-medical determinants of health including living and working conditions, resources, or environmental factors such as smoking or use of alcohol (Statistics Canada, 2024a). Similarly, asking respondents if they have experienced “aggressive driving” from other motorists necessitates a common understanding of what this includes, such as aggressive tailgating, lights flashed at them because the other motorist was annoyed, rude gestures, and/or being deliberately obstructed or prevented from moving their vehicle (Neuman et al., 2003).
Finally, one way to be sure you are writing clear questions is to assume a lack of knowledge about the subject matter. For example, a criminologist interested in public opinion toward crimes and associated penalties should not assume that respondents understand anything about crime from a legal perspective (e.g., how Canada’s legal system originated) or how specific crimes are categorized in Canada (e.g., based on their perceived seriousness and depending on the intended victim of harm). All relevant background information should be provided, along with definitions for all crime-related terminology that would not be considered general knowledge.
Keep It Short
Words, questions, and the survey itself should all be kept relatively short. In most cases, word concepts should be stated at the most basic level possible. For example, the term job or where you work is more straightforward than employer or place of employment, and a prompt for the city where you live is much easier to interpret than the locality where you currently reside. Similarly, long questions are more difficult to interpret since they may raise several points or include multiple concepts, and this increases the likelihood that different respondents will hear or read different things into the question being asked. Even the overall length of the survey itself is a concern. The longer it takes to complete a questionnaire or interview, the greater the likelihood that respondents will lose interest, potentially leading to more errors. For example, respondents may give inaccurate answers because they are no longer paying close attention to what is being asked or are rushing to finish. In addition, length can contribute to a greater tendency for respondents to leave items blank or choose to end their participation before completing the survey.

Minimize Bias
Minimizing bias is also an important goal in the creation of good survey questions. Bias exists when a question is worded in such a way that a response appears to be the most appropriate one or is favoured in some way. For example, it would be difficult for a respondent to disagree with an item stating “To ensure the highest quality education for Canadian children, a greater portion of tax dollars must be spent on education.” From a social desirability standpoint, few respondents would admit they fail to endorse a practice tied to quality education. Similarly, an item asking “As a proud Canadian, do you plan to vote in the next federal election?” implies that only those who are ashamed to be Canadian would respond in anything but the affirmative. A question is considered leading if it suggests the appropriate answer. Instead, questions should be worded in a neutral, value-free manner, as in “Do you support giving more tax dollars to education?” and “Do you plan to vote in the next federal election?” or “Did you vote in the last federal election?”
A question can also be biased by the inclusion of endorsements by high-ranking individuals. For example, knowing the president or senior manager of a company supports a position makes employees more likely to provide similar opinions. Similarly, a question can be biased by references to prestigious institutions, organizations, or professions, such as “Do you agree or disagree with the Canadian Medical Association’s decision?” or “Do you agree or disagree with the proposed solutions suggested by researchers at McGill University?” While there is no guarantee of an endorsement, in these examples, the prestige of the person or organization biases the likelihood that respondents will provide support (Babbie, 1990).
Ensure Relevancy and Currency
Surveys also need to be relevant to most participants. That is, if a researcher is interested in attitudes toward some topic, it should be a topic that the respondents know about and are likely to have an informed opinion on. Most students, for example, can tell a researcher about the quality of instruction they received in a course they have taken. Course evaluation surveys are especially relevant to students more so than they are to administrators, who may know something about the class and instructor based on the course outline, a peer review, or the instructor’s employment history, but they lack the overall knowledge of what occurs in the classroom on a regular basis. Similarly, a student resource centre looking for ways to improve its services to students with disabilities should ask its client base, not the more general student body, for direction.
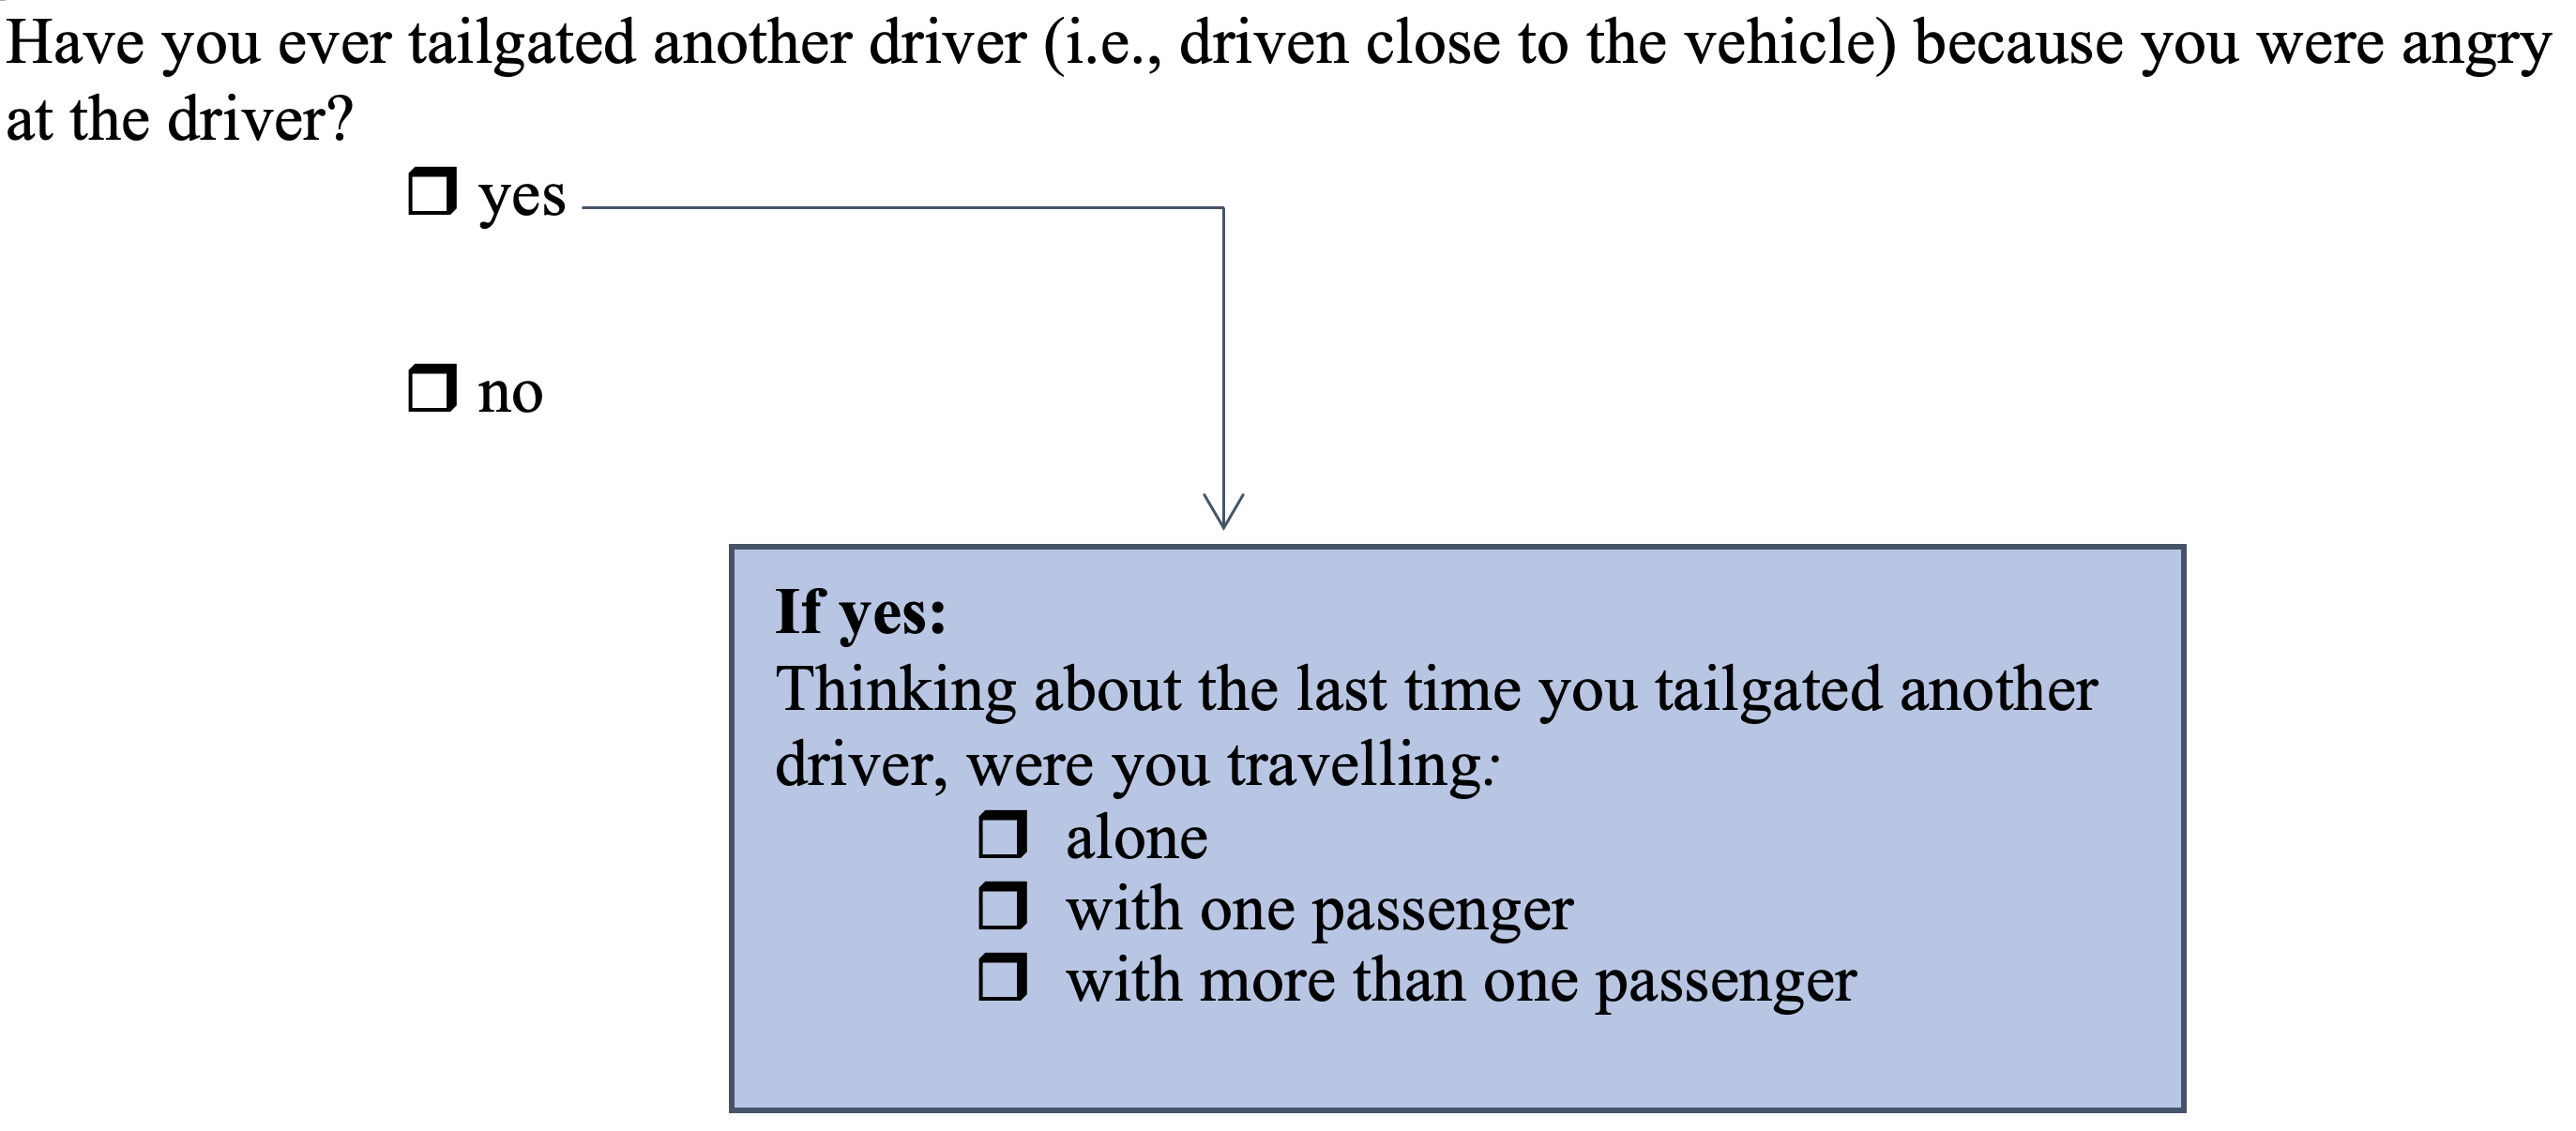
Even with a carefully selected sample, not all questions on a survey will apply equally to all participants. Consider the case of a criminologist who is interested in learning more about variables associated with aggressive driving. Rather than ask a series of questions about each aggressive form of driving that may only apply to a very small fraction of the respondents, the researcher can include contingency questions. Contingency questions are questions answered only if an item is relevant to the respondent. This is usually determined by an affirmative response to a main question on the issue. If the item does not apply, the respondent is supposed to skip over to another part of the survey. If the item applies, the respondent is prompted to answer one or more subsequent questions. Figure 7.2 shows how a main question about one form of aggressive driving with a contingency question could appear on a questionnaire.
Finally, to help increase accuracy, survey questions should be limited to events occurring now or events that happened in the not-too-distant past or will happen in the not-too-distant future. For example, if I asked you what classes you plan to enroll in next semester, I would obtain more reliable results than if I asked you what you plan to enroll in two years from now. Similarly, asking respondents about daily events, such as what they had to eat or drink in the last 24 hours, is likely to produce a much more accurate recollection than asking them what did last month or even last week. Therefore, course evaluations occur near to the end of the term while students are still in the classes they are evaluating. Imagine rating a class you took several years ago. How many details can you recall pertaining to how the instructor organized the class or whether course materials were appropriately reflected on exams? An exception to this rule are rare, but highly salient events are likely to be recalled for a much longer period. For example, people can readily recall victimization experiences: “Within the last year, were you the victim of a motor vehicle theft?” Significant experiences are also likely to be inaccurately reported by respondents who tend to bring important events forward in time, which is a survey response error known as “telescoping.” That is, a respondent might say “yes” to victimization involving a motor vehicle theft even though the person’s car was stolen three years ago, not within the last year. This occurs because the event is salient to the respondent, not because the respondent is intentionally fabricating a response.
Avoid Double-Barrelled Questions
In addition to suggestions for what researchers should do, there are also practices researchers should try to avoid in question construction. First, researchers should avoid double-barrelled questions. A double-barrelled question is a question prompting a “single answer to a combination of questions” (Babbie, 1990, p. 128). The question contains more than one idea, often identified by the joiner and. For example, an item asking respondents to agree or disagree with the statement “The Canadian government should spend more money on healthcare and the environment” contains two separate opinions, one related to healthcare and one about the environment. What if the respondent feels more money should go to healthcare but not the environment (or vice versa)? In either case, a respondent would likely provide a neutral response to reflect a combination of agreement and disagreement, even though their response is not neutral toward either item.
Avoid Negative Questions
Researchers should avoid the use of negative questions. A negative question is a question comprising the negative or opposing form of a statement. In everyday usage, a negative question generally prompts a favourable response. “Don’t you hate it when it rains on golf night?” “Yes, I do hate it.” “Aren’t you going to accept your award in person?” “Yes, I am.” “Isn’t this cheesecake excellent?” “Yes, it is.” If you have encountered one of these questions on a multiple-choice exam, it likely took the form of an item asking you to pick out the exception: “All of the following statements are part of this theory except …” or “Which of the following is not part of this theory.…” Although commonly used in the English language, negative questions on surveys are difficult to understand and should be reworked into the affirmative form. Consider the case of motorists in Ontario who are caught eating while driving or texting while using a hand-held device such as mobile phone and fined $615 (Ontario Ministry of Transportation, 2022). A negative question on a survey by the transportation ministry might be “Don’t you support the distracted driving law?” In the positive format, it is much easier to understand as “Do you support the distracted driving law?”
Avoid Technical Terms, Abbreviations, and Other Jargon
Researchers should also steer clear of highly technical or specialized terms, abbreviations, and informal jargon. Every group, organization, profession, culture, and subculture develops its own specialized language over time. At a Canadian university, students might be able to learn more about becoming an RPN (registered psychiatric nurse), find out about a BSC degree (Bachelor of Communications Studies), attend a meeting of the AGC (Academic Governance Council), apply to the REB (research ethics board), and see what the SIFE (Students in Free Enterprise) club is up to. While convenient for those directly involved in such groups, abbreviations are meaningless to those outside the group and/or can be readily misinterpreted. For example, AGC also stands for Associated Gospel Churches of Canada, and it is the name of a Canadian automotive glass assembly company. Researchers should always include the full name the first time an identifying term is used and, when necessary, explain what the term refers to.
Slang terms, sometimes called idioms or jargon, are words or phrases that are widely used and understood within the culture or group in which they originated. For example, an anger scale that asks about a respondent’s tendency to “fly off the handle,” meaning “lose one’s temper,” is unlikely to be understood by someone whose first language is anything but English. Similarly, regular users of marijuana may refer to their drug of choice as pot or weed. Pot smokers understand how to roll a joint and inhale by taking a toke. They might also save the roach (i.e., the butt left from a joint) if they are running low on supply. If a survey is directed at a subgroup, the slang for that subgroup might be relevant to incorporate. However, if the survey is aimed at a more general population, avoid slang terms.
Activity: Survey Dos and Don’ts
Developing Response Formats
Sometimes a survey respondent is asked to provide any answer that comes to mind, while in other cases a respondent is asked to choose a response that best approximates their view.
Open- and Closed-Ended Questions
Open-ended questions prompt any response a participant deems appropriate in their own words, such as “In your opinion, what are the advantages of published ratings of instruction?” This could be answered in an infinite number of ways. One student might answer that question by noting “I would use them to help me choose courses,” while another student might respond with “They help students match their learning styles with particular instructors.” Open-ended questions are advantageous for obtaining highly detailed responses, learning about unanticipated views, and finding out how respondents think about certain issues (i.e., their thought processes). Open-ended questions are used most often in cases where the response categories are not well known in advance, as might be the case in a more exploratory study. For example, in looking for effective ways to reduce prostitution, a criminologist might ask sex-trade offenders if there are any potential consequences for their actions that would lead them to stop using the services of sex-trade workers.
Closed-ended questions prompt a participant to respond using a predetermined or a fixed-choice set of responses, usually consisting of four, five, or seven choices. Closed-ended questions often require carefully worded instructions that help the participant understand how to respond, much like you might be instructed to choose the one best option from a set of four potentially correct responses on a multiple-choice test. By using the same response choices and by limiting the number of possible responses across participants, researchers can readily code, analyze, and compare the answers provided. A drawback is that respondents can select answers to questions they know little or nothing about (much like a student might guess on a multiple-choice exam). In addition, the answer a respondent wishes to provide may or may not be included in the provided set of response choices.
The most commonly used response format for questionnaires are closed-ended ordinal categories because they are easy to complete, they allow for a range of intensity in responses, and they lend themselves well to the measurement of attitudes and behaviours (Dillman et al., 2014). For example, Howell and Symbaluk (2001) asked students to provide views on potential outcomes of published ratings of instruction. One question asked, if instructor evaluations were made accessible to students, how likely is it that this practice would “increase the likelihood that students will participate in student ratings of instruction”? Students were asked to rate the likelihood using an ordinal measure ranging from not at all likely, to slightly likely, to moderately likely, to very likely, to extremely likely.
Another especially popular response category arrangement is the use of a Likert format depicting levels of agreement with the ratings: strongly disagree, disagree, neutral, agree, and strongly agree. For example, students might be asked to indicate their level of agreement pertaining to the statement “Overall, my instructor is effective” by checking off the appropriate response box:
strongly disagree disagree neutral agree strongly agree
The five-point response categories listed above are preferred for a number of reasons: they are balanced, in terms of positive and negative options; they allow for sufficient discrimination among responses; they are readily understood by most respondents; they have a neutral midpoint that is preferable over the use of “don’t know”; they are especially amenable to use in online surveys; and they are easy to score for the purpose of analysis (Brace, 2018).
Response categories for closed-ended questions should always be exhaustive and mutually exclusive. Exhaustive signifies that the choices are comprehensive enough to cover the range of all possible responses. For example, asking participants in an internet survey to select their age from a set of age categories—for example, 19 and under, 20 to 29, 30 to 39, 40 to 49, 50 to 59, and 60 to 69—doesn’t allow for the appropriate selection by individuals 70 years of age and older. To remedy this so the categories are exhaustive, the researcher should add additional categories and/or include an open-ended final category, such as 70 and over. Mutually exclusive indicates that all response categories are separate and distinct from each other. Age responses would not be mutually exclusive if one category included those “20 and under” while the next category was “20 to 30” because the categories overlap. A respondent’s age should correspond to one and only one response category. Due to the limited number of responses, closed-ended items are much easier to code for and interpret than open-ended items at the data analysis stage of research.
In addition to the wording of questions and response categories, a survey researcher needs to think through a few other considerations before finalizing a survey instrument.
Appealing Format and Design
Every effort should be made to make a questionnaire as professional looking and appealing as possible to the potential respondent. This can include decisions about the type of font used, the size of the lettering, the arrangement of the questions, the style of the question numbering, and the format of the responses. While there is no exact formula for what works and doesn’t work, the objective is to strike a balance between design appeal and ease of completion. Respondents are more apt to complete a questionnaire that is easy to navigate. This means the questions should be well spaced (uncluttered) and the response formats should be clearly laid out and be relatively easy to complete.
Perhaps the questionnaire can be divided into three sections with 10 questions in each. Answering this seems less daunting than answering 30 questions in a row. Related questions on the same topic should generally be grouped together. Also, by using the same response formats for a series of questions or items, respondents can provide answers quite quickly and will be less discouraged by survey length. That said, there should also be some variation in question and response formats to prevent respondents developing the tendency to provide the same answer throughout, regardless of the specific question. For example, if a person agrees with one item, that person may agree with most items without reading them carefully.
Clear Instructions
Whether in questionnaire or interview format, a respondent completing a survey needs to be provided with clear instructions for how to provide responses. Are respondents supposed to indicate their opinion by checking off a box, circling a number, or providing a written response? Are respondents supposed to choose all responses that apply to a given question or only the one that most closely approximates their view? In the case of an interview, are respondents supposed to choose from a range of answers provided or say anything that comes to mind? Even trained interviewers need carefully laid out instructions for how to proceed with the survey and how to give standardized responses to potential questions raised by the respondents.
Question Order
Researchers also need to be careful about the order in which specific questions are included. It is a good idea to include a few relatively simple non-threatening questions at the beginning of a survey, such as demographic questions designed to describe the respondent, like “Are you a full- or part-time student?” and “On which campus do you mainly attend classes?” Sensitive questions tend to be ones that involve personal attributes or issues (e.g., income, mental health, ethnicity, relationships), private behaviour (e.g., sexual behaviour, alcohol consumption), or socially undesirable practices (e.g., aggressive driving, racism)—all of which are likely to form the basis of research in the social sciences. Non-threatening questions are especially important at the start of interviews, where developing good rapport with the respondent can be critical to securing participation. Sensitive questions should be left until near the end of a survey because, by this point, the respondent has already developed a rapport with the interviewer or has already invested time on the questionnaire and will be more likely to provide answers. Also, placing threatening questions near the end helps to ensure that most of the survey will be completed even if respondents choose not to respond to these items (Brace, 2018; Rea & Parker, 2005).
Pre-Testing the Instrument
The best way to obtain feedback about the design, length, wording, formatting, instructions, or any other survey feature is to pre-test it. A pre-test is a trial run using a different group of respondents than those who will be included in the final sample. Just as having someone proofread a paper of yours before you turn it in to your professor can identify errors, a pre-test can help identify problems with the survey. At the minimum, a pre-test will help determine if respondents can readily follow the instructions as intended, if the questions are worded clearly, if the responses are appropriate, if there are any obvious errors, and how long it takes to complete the survey.
Test Yourself
- What features make for good survey questions?
- What practices need to be avoided in the construction of good survey questions?
- When would it be appropriate to use an open-ended question?
- Why is question order important in the creation of a survey?
Research on the Net
Researchers from St. John’s, Newfoundland and Labrador, used an online survey to examine public attitudes and towards genomic sharing. The majority of respondents (N = 697) either agreed or strongly agreed to sharing their genomic data with restricted scientific databases such as those accessed by clinicians and medical researchers but were generally opposed to open forms of data sharing. Additional comments indicated that respondents were largely against any use of the data for profit. Prior knowledge of genome sequencing and the existence of a provincial health research ethics board were related in the sense that respondents who lacked these forms of knowledge were least likely to be comfortable with data sharing (Etchegary et al., 2023).
CHAPTER SUMMARY
- Describe the purpose of a survey and the kinds of questions asked using surveys.
The purpose of a survey is to find something out by asking questions. A researcher might choose this method to describe a population, to learn more about people’s feelings about some issue, to determine the frequency of certain behaviours, and/or to examine ways in which various variables are related. Common types of questions include demographic questions that help describe a population’s features, knowledge questions about facts, attitude questions comprising opinions about people and events, and behaviour questions about respondents’ actions and experiences. - Explain why research objectives need to be clarified prior to the onset of research.
The research objectives outline what the study is about, and they provide direction for the creation of appropriate questions for obtaining answers on the topic of interest. Questions that help facilitate this process include “What needs to be known?”; “Why does it need to be known?”; “What else needs to be known?”; “What will the results of the survey accomplish?”; “What decisions will be based on the results of the survey?”; and “Is a survey the best method?” - Outline key methodological considerations that precede survey research.
A researcher needs to decide upon the type of design for the survey (e.g., a longitudinal or cross-sectional design), which sampling method is most appropriate (e.g., a probability- or non-probability-based technique), who will be included in the sample, and how the central variables are to be measured or how to design the survey. In addition, a researcher needs to determine if the survey will be administered using a questionnaire or interview format, how relevant ethical concerns will be addressed, and how the survey will be administered, such as in person, by mail, over the internet, or by telephone. - Compare and contrast questionnaires and interviews.
A questionnaire is a data collection tool consisting of a series of questions or items to which a respondent provides answers. An interview is also a structured data collection method, but in this case an interviewer asks the questions and records the answers provided by the respondent. Face-to-face interviews produce the highest response rate and result in rich, detailed information but also constitute the most expensive and time-consuming survey data collection method. Interviewer bias is also problematic in the case of in-person interviews and is alleviated using mail-out questionnaires. Mail-out surveys also afford greater anonymity to the respondent, who is more likely to provide answers to sensitive questions but less likely to complete or send back the survey. Telephone surveys are good for establishing rapport (like face-to-face interviews), they are less costly than in-person surveys, and they take less time to conduct. However, sampling frames are likely to be incomplete, and it is difficult to establish trust and credibility over the phone. Internet surveys can reach a vast number of respondents and collect information inexpensively in a short period of time. The greatest drawback to internet surveys is their lack of a random sample and their low overall response rate compared to the other data collection formats. - Identify recommended “dos” and “don’ts” in the construction of surveys.
Good survey questions are clear, short, free from bias, relevant, and time sensitive. Poor questions that need to be avoided contain terms and phrases that are double-barrelled, negative, highly technical, abbreviated, or full of jargon. Open-ended questions prompt any response deemed appropriate by the participant, whereas closed-ended questions force the respondent to choose an answer from a fixed set of responses. Surveys should also have appealing designs and clear instructions, be carefully ordered, and undergo pre-testing.
RESEARCH REFLECTION
- For each of the following statements, indicate why it is not suitable as a survey question and then rewrite it to correct for the error. Assume that students were instructed to rate their level of agreement with the following statements.
- The instructor was helpful and organized.
- The instructor posted lectures notes on the course management software for students to access online.
- The instructor didn’t always start class on time.
- The instructor used effective pedagogy to facilitate student engagement.
- The dean’s offer of full-time employment to this instructor is a good decision.
- Suppose a researcher wished to describe the prevalence of dangerous driving among motorists in the province of Ontario. Design five closed-ended survey questions that could help meet this research objective.
- Have you ever consumed an energy drink, such as Red Bull or Monster Energy? Suppose you were going to develop an internet survey on the effects of caffeinated energy drinks for consumers. List five questions you would ask respondents. Compare your questions to those posed by researchers in Ontario who examined the adverse effects of caffeinated energy drinks on Canadian youth and young adults using a web-based survey (see Hammond et al., 2018).
- Researchers at Queen’s University and York University examined coping mechanisms among youth who experience cybervictimization. Cybervictimization was operationalized as “being threatened, embarrassed, singled out, gossiped about, or made to look bad through the Internet, text messages, or pictures” (Hudson et al., 2016, p. 6). If you were designing a similar study today, how would you operationalize coping mechanisms?
LEARNING THROUGH PRACTICE
- Pair up with someone else in class.
- Identify various service providers on campus (e.g., the library, a lunch vendor, the computer help desk).
- Select one of the service providers and discuss ways in which it could be evaluated (e.g., speed of service, quality of service).
- Design a questionnaire consisting of four closed-ended questions and one open-ended question that could be used to evaluate different aspects of the services provided.
- Pilot test the five questions with another pair from the class. Make any necessary revisions to the questionnaire based on information provided during the pilot test. For example, are you measuring what you intend to? Were the questions clear to the pilot testers?
RESEARCH RESOURCES
- To learn more about sampling approaches, questionnaire design, and ensuring survey quality, refer to Eichhorn, J. (2022). Survey research and sampling. Sage.
- To find out what a national crime victimization survey can tell us about stalking behaviours, see Reyns et al. (2024). Identifying and explaining the harmful effects of stalking victimization: An analysis of the national crime victimization survey. Justice Quarterly, 41(2), 218-242.
- To learn how to supplement random digit dialing with the use of social networks, refer to Agans et al. (2021). Using social networks to supplement RDD telephone surveys to oversample hard-to-reach populations: A new RDD +RDS Approach. Sociological Methodology, 51(2), 270-289.
- To learn more about ordinal response categories including rating scale analysis, see Wind, S. A. (2023). Exploring rating scale functioning for survey research. Sage.
An information collection method used to describe, compare, or explain individual and societal knowledge, feelings, values, preferences, and behaviours.
Questions designed to collect facts about a respondent’s age, race/ethnicity, education, job, gender, marital status, geographic place of residence, type of residence, size of family, and so on.
Questions designed to gauge whether respondents can retrieve and correctly report on facts about some area of interest.
Questions designed to measure points of view toward an attitude object, such as a person or an event.
Questions designed to find out more about the respondent’s activities.
The percentage of those sampled for whom data are collected.
A type of error that results when the list from which sample members are drawn does not accurately represent the population on the characteristic(s) one wants to estimate with the survey data.
The difference between the sample statistic and the population parameter.
The difference between the estimate produced when only some of the sampled units respond compared to when all of them respond.
A survey data collection instrument consisting of a series of questions or items to which a respondent provides responses containing the information of interest to the researcher.
A highly structured data collection method consisting of a series of prescribed questions or items asked by an interviewer who records the answers provided by the respondent.
A technique used to generate a random sample of phone numbers from a sampling frame created using the assigned area codes for a given location.
A telephone-based interview method in which the interviewer inputs survey responses directly into a software program.
A question prompting additional information about a previous item identified as relevant for the respondent.
A question prompting a single answer to a combination of questions.
A question comprising the negative form of a statement.
A question prompting any response deemed appropriate in the participant’s own words.
A question prompting an answer selected from a pre-determined set of responses provided.
Comprehensive enough to include all likely responses.
Response categories are separate and distinct from each other.
