Chapter 8: Unobtrusive Methods
A major confounding factor in social research is eliminated in nonreaction studies because the observed person or group is not able to react to the measurement process— that is, is not able to manipulate presentation-of-self for the researcher.
— Winston Jackson & Norine Verberg, 2007, p. 143
Learning Objectives
After reading this chapter, students should be able to do the following:
- Define unobtrusive methods and explain what is meant by reactive and non-reactive research methods.
- Explain what physical trace analysis is used for and differentiate between erosion and accretion measures.
- Differentiate between public and private archives and note a main advantage and disadvantage of archival analysis.
- Define content analysis and outline the steps for conducting a content analysis.
- Explain what secondary analysis of existing data entails, identify key sources for secondary data analysis, and note a main advantage and disadvantage of secondary data analysis.
- Define digital media and explain how the internet has changed the nature of social research and the methods used to study it.
INTRODUCTION
Most methods rely upon participants who provide the data of interest to researchers through their actions or words, such as experiments, surveys, ethnographic studies, or qualitative interviews. These methods are considered obtrusive because they necessitate an intrusion into the lives of participants to obtain the data. They are also considered to be reactive because participants are responding or reacting to the research instrument (e.g., the questions posed on a questionnaire or an experimental manipulation), the researcher (e.g., a qualitative interviewer), and/or to the study itself (e.g., demand characteristics). In contrast, non-reactive methods, called unobtrusive research methods, are ones in which “the researcher examines evidence of people’s behaviour or attitudes, rather than interacting directly with those being studied” (Strand & Weiss, 2005, p. 161). This evidence takes the form of a variety of sources of information created by and for people (e.g., government statistics, official documents, newspaper stories, personal diaries, song lyrics, and television scripts), and it can also include things left behind by people (e.g., litter, belongings, patterns of erosion). Notably, the information is originally produced for a particular purpose (e.g., song lyrics might be designed in order to express an artist’s creativity and to make money for producers), but it is later examined by social researchers for a different purpose (e.g., to determine the prevalence of gender stereotypes in a music genre), thereby circumventing issues of reactivity since the song is already written and produced.
As early as 1966, Gene Webb and Don Campbell (joined by Richard Schwartz and Lee Sechrest in 1981) wrote about the need for innovative, non-conventional means for finding things out, which they originally dubbed “oddball research” and “oddball measures.” For example, they noted how the careful examination of children’s drawings, library withdrawals, and worn floor tiles could be used to inform researchers about children’s interests, the potential effects of new forms of media, and the popularity of museum exhibits (Webb et al., 2000). Unobtrusive methods include any number of non-reactive measures or techniques. This chapter examines four types of unobtrusive measures that are classified based on characteristics of the data studied: (1) forms of physical evidence examined using physical trace analysis; (2) public and private records that are observed using archival analysis; (3) written, spoken, or visual messages examined using a technique called content analysis; and (4) official statistics and other forms of existing data studied through secondary analysis. This chapter explains how physical trace analysis, archival analysis, content analysis, and secondary analysis can be used to examine data unobtrusively; that is, in a manner that is independent from the original processes that produced it (Lune & Berg, 2021).
Activity: Obtrusive Versus Unobtrusive Methods
PHYSICAL TRACE ANALYSIS
Physical traces are the “remnants, fragments, and products of past behaviour” (Shaughnessy et al., 2015, p. 107). Just as a criminal investigator might examine a crime scene for remaining clues such as finger prints, blood stains, or clothing fibres, researchers can examine locations for physical evidence that helps them to better understand humans based on their past behaviour. This is not unlike what archeologists and anthropologists have been doing for centuries as they study bones, artifacts, and other aspects of material culture left behind by humans to learn more about earlier civilizations. Physical traces are usually one of two types. First, physical traces can take the form of erosion measures or use traces “where the degree of selective wear on some material yields the measure” (Webb et al., 2000, p. 36). Erosion measures indicate patterns of human use, as in the case of heavily worn and dirty carpets or flooring in high-traffic areas on a university campus. Similarly, pathways woven through the grass between buildings can indicate frequently used routes or desired walkways.
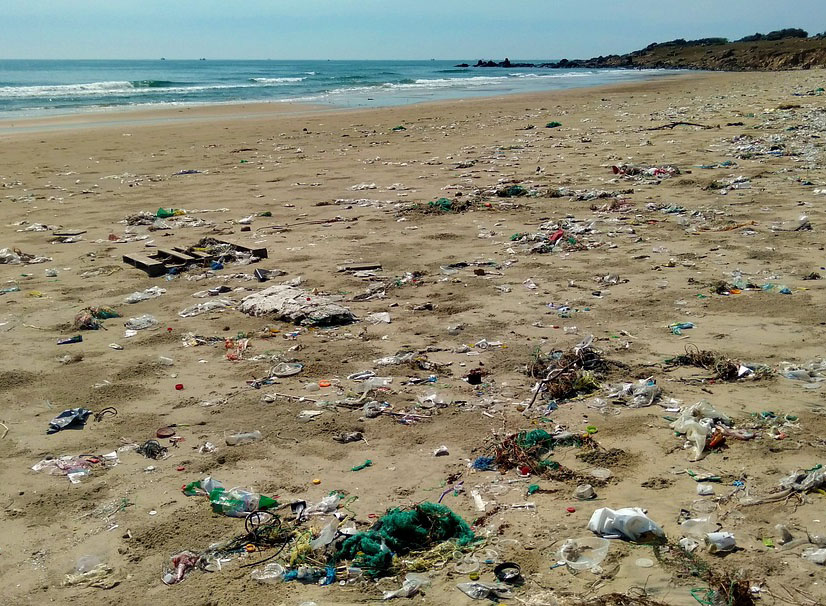
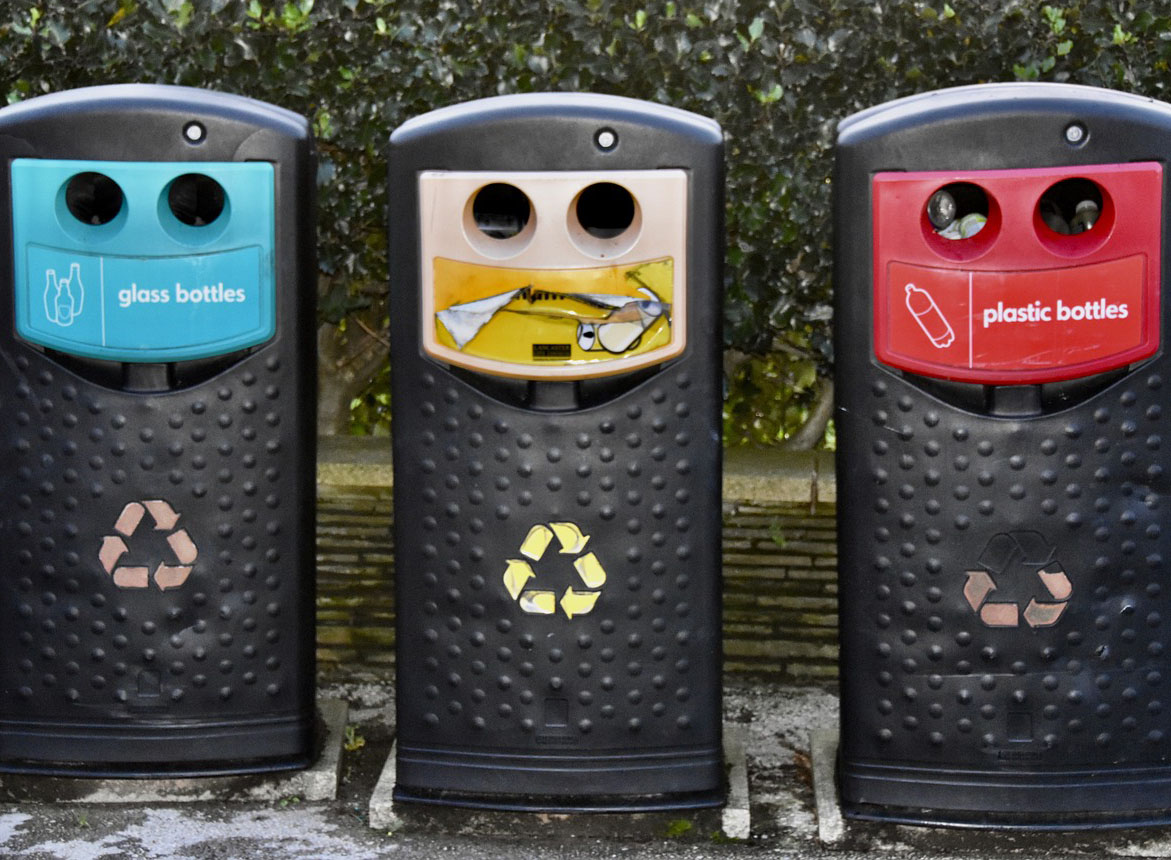
Physical traces can also take the form of accretion measures, “where the research evidence is some deposit of materials” (Webb et al., 2000, p. 36). Accretion measures are products left behind due to prior activity, such as waste or graffiti. For example, the accumulation of empty beer, liquor, and wine bottles in a recycle bin can help to establish the level of alcohol consumption in a given household. The analysis of waste in trash bins can reveal information about people’s habits such as their nutrition and dietary practices, material use and misuse, and waste disposal and recycling efforts.
Garbology
The term garbology is frequently used today to refer to the study of behaviour based on the analysis of waste. Garbology as an academic pursuit can be traced to William Rathje (1945–2012), an archeologist at the University of Arizona who founded the Garbage Project, which lasted from 1973 to 2005. In an earlier independent studies project, two of Rathje’s students examined the correspondence between stereotypes and “physical realities” through a comparison of the trash collected from two affluent and two poor families (Humes, 2012). Results showed that all four homes consumed similarly, with the same amounts and types of foods and drinks. However, the poorer households spent more on educational items for their children and they bought more household cleaners than the affluent ones (Rathje & Murphy, 2001). Although questionable due to the small sample size and limited time frame for analysis, the findings nevertheless sparked an interest in Rathje that resulted in a career-long exploration into the assumptions and potential misconceptions related more generally to consumption and waste disposal.
Instead of going out on archeological “digs,” Rathje and his students excavated carefully sampled garbage that was re-routed by the sanitation department and dumped at the University of Arizona (Humes, 2012). For more than three decades, Rathje and his students surveyed, itemized, counted, and weighed garbage, dispelling popular myths about what is most commonly thrown away and what happens to trash after it gets thrown away. For example, while the American public believed that the most common forms of solid waste were diapers and take-out food containers, more prevalent forms of waste turned out to be newspaper and building materials. Another interesting finding was that consumption increased, as opposed to decreased, during food shortages, especially when red meat was scarce. The Garbage Project also showed how many forms of organic waste were unexpectedly preserved by plastics rather than broken down over time in landfills. Finally, how people behave is very different from how they claim to behave, as evident in the under-reporting of unhealthy consumption (e.g., chips, bacon, and alcoholic beverages) and the over-reporting of healthy intake (e.g., cottage cheese, high-fibre cereals, and skim milk) (Rathje & Murphy, 2001).
Graffiti
Graffiti is a special kind of accretion measure that takes various forms and is interpreted in just as many ways. For example, Decker and Curry (2024) define graffiti as:
[A] form of visual communication, usually illegal, involving the unauthorized marking of public space by an individual or group. Although the common image of graffiti is a stylistic symbol or phrase spray-painted on a wall by a member of a street gang, some graffiti is not gang-related. Graffiti can be understood as antisocial behaviour performed in order to gain attention or as a form of thrill seeking, but it can also be understood as an expressive art form. (para. 1)
As a means of self-expression, graffiti commonly takes the form of “tagging,” which involves personalized signatures, or “piecing” and “bombing,” which includes much more highly specialized forms of artwork created with spray cans to embody names and symbolize subcultures (Alonso, 1998). Graffiti also consists of written phrases and statements that express viewpoints and positions (Abel & Buckley, 1977). For example, predominant themes include gang graffiti denoting territories, political graffiti, or derogatory forms of graffiti directed at groups (Alonso, 1998). Graffiti can also take the form of ongoing dialogue as one graffiti writer responds to what another has written, as in the case of bathroom graffiti. The graffiti that appears on the stalls inside bathrooms is usually referred to as “latrinalia” (Abel & Buckley, 1997; Melhorn & Romig, 1985). Smith and Starcke (2023) examined longitudinal patterns of graffiti on campus at a large university in the United States and found a wide variety of forms including themes of awareness, graphic art, school spirit, current events, religion, the environment and sexual orientation. Some forms of graffiti were more likely to be visible untouched for a greater duration than others. For example, religious artifacts tended to last longer than ones related to sexual orientation or school spirit (Smith & Starcke, 2023).
Graffiti also occurs within subcultures and in response to historical events. Rawlinson and Farrell (2010), for example, examined construction site graffiti at 10 large-scale construction projects and identified various common subcultures of graffiti producers (e.g., subcontractors, trades, and football fans), as well as various predominant themes within the graffiti itself, such as celebrations of ownership and personal immortalization. Hagan et al. (2005) studied disaster graffiti following a major flood, which they coined “catastroffiti.” The Red River Valley flood of 1997 took place along the Red River in North Dakota, Minnesota, and southern Manitoba. The most dominant theme in the graffiti following the flood was humour as a coping mechanism. Even within the humorous graffiti, several themes emerged, including jocular humour (e.g., “1-800-big-mess”), sarcasm (e.g., “Are we having fun yet? Keep it up!”), and satirical humour (e.g., “49 FEET MY ASS”) in response to a nearby dike that was supposed to be fortified to 52 feet (Hagan et al., 2005).

Research in Action
Rolling Like Thunder
Rolling Like Thunder (2021) is a documentary about graffiti directed by Roger Gastman and produced by Mass Appeal for SHOWTIME. This film documents “freight writing”—a dangerous, illegal, and long-lasting form of graffiti that involves painting trains. Check out the Rolling Like Thunder trailer on YouTube.
Advantages and Disadvantages of Physical Trace Analysis
The biggest advantage of using physical trace analysis pertains to the use of non-reactive measures. Because the traces already exist, they are not subject to the problems inherent in surveys and experiments where participants may alter their responses as a function of being studied, such as trying to please the researcher or to appear socially desirable. In most cases, the originators of the physical evidence will never even know it was examined for research purposes. This means the physical traces are likely to have occurred naturally. As a result, the garbologist studying what was thrown out can be reasonably sure that the data reflect true habits versus what would or would not be thrown away if people knew ahead of time their waste was going to be examined, perhaps to see how many items could have been diverted from a landfill through recycling efforts. In addition, except for graffiti deliberately designed in some instances to identify its authors, physical traces are anonymous because the originators are long gone from the scene when researchers arrive to examine the remaining evidence.
Although free from participant biases common to reactive measures, physical trace measures raise questions concerning the validity of the inferences drawn from the measures. For example, does the presence of lots of cleaning products in a trash bin indicate that a residence is likely to be clean or dirty? Similarly, does the absence of cleaning products mean little cleaning is taking place or something else, such as hired house cleaners bringing in and taking supplies with them? In addition, since the researcher cannot determine who the originator of the data is, it is difficult to generalize with certainty the findings to any given group or subculture. This is compounded by the fact that only certain kinds of traces are likely to persist long enough to make it into a study (e.g., worn carpets get cleaned or replaced, floors can be polished, rain can wash away footprints, and graffiti can be painted over). Webb et al. (2000) point out that especially in the case of accretion measures, some physical traces have a higher probability of being established in the first place, while others have a higher probability of surviving over time. They refer to these drawbacks as selective deposit and selective survival biases. Thus, while physical trace measures can constitute a novel means for studying past behaviour, researchers need to be aware of the potential for biases. One way to help establish the validity of the measures as true indicators of behaviour is to combine physical trace analysis with other methods to see if they all point to similar conclusions, thereby demonstrating convergent validity of the measures.
Test Yourself
- Physical traces usually take the form of which two measures?
- What can we learn through an analysis of waste?
- Which type of physical trace measure is graffiti?
- Which two biases are of concern to researchers using physical trace measures?
ARCHIVAL ANALYSIS
Archives are historical documents, records, or collections of information that detail the activities of businesses, agencies, institutions, governments, groups, or individuals. To help you understand what archives consist of, consider the various organizations or institutions that can be considered archival sources for information pertaining to you, such as the current school you attend as well as any previous school you attended, employers, creditors, doctors’ offices, and perhaps even a hospital or police agency. Now think of the different ways that information about you and others can be collected and stored, such as in files, as journal entries, and in electronic format. Finally, consider that archival data can be public or private in nature.
Public and Private Archives
Public archives are public records that are prepared specifically to be examined by others. Public archives tend to be continuous and ongoing, as in the case of running records, such as monthly budgets or annual reports; official documents, such as school attendance records or hospital intake records; and library collections, such as periodicals and books. Public records are also prepared, collected, or organized in standard ways, such as arranged alphabetically, organized by date, indexed, and so on.
Research on the Net
Library and Archives Canada
The largest collection of Canadian public archives is Library and Archives Canada. As of 2004, the collection brings together what used to be the National Archives of Canada (established in 1872) and the National Library of Canada (founded in 1953) (Library and Archives Canada, 2025). The vast collection includes Canadian films and documentaries; architectural drawings, maps, and plans; periodicals and books; letters, diaries, photographic images; video and sound recordings; works of art, including watercolours, sketches, miniatures, oil paintings, and caricatures; sheet music; postal archives; medals, seals, posters, and coats of arms; textual archives; national, provincial, and territorial newspapers; periodicals, microfilms, and theses; portraits of Canadians. To conduct an archives search, visit the Library and Archives Canada website.
Researchers sometimes further categorize public archival data based on characteristics of the data itself. For example, Lune and Berg (2021) modernized the original archival categories first described by Webb and his colleagues into three main groups: commercial media accounts, actuarial records, and official documentary records. Commercial media accounts are artifacts created for mass consumption (Lune & Berg, 2021). These public archives can include books, newspapers, periodicals or magazines, television program transcripts, film scripts, photographs, music lyrics, radio broadcasts, X tweets, YouTube videos, website information, and so on. Actuarial records are created for access by a more limited audience but they are technically available to the public under special circumstances (Lune & Berg, 2021). Examples of actuarial records include birth, death, marriage, and divorce records, as well as things like land titles and credit histories. Official documentary records are those produced for a very limited audience although they may eventually end up in the public domain (Lune & Berg, 2021). Official documentary records can include school, hospital, dentist, or medical records, as well as court documents, police records, minutes from meetings, annual reports, sales records, and so on.

Researchers may later examine public archives, such as official records collected for one purpose, for a completely different purpose. For example, Moulden et al. (2010), from the University of Ottawa in Ontario, examined official documentary records collected on convicted sexual offenders to learn more about patterns of sexual offending involving teachers. Specifically, the researchers analyzed archival Violent Crime Linkage Analysis System reports obtained from the Royal Canadian Mounted Police to describe the offending of 113 Canadian teachers who committed a sexual offence against a child in their care between 1995 and 2002. Archival analysis indicated that most offenders abused a position of trust to initiate contact with the victim (84 percent). In addition, many of the offenders befriended the victim (40 percent), offered a form of assistance to the victim (16 percent), or offered the victim money, treats, toys, or work (14 percent). In addition, findings showed that many of the offences occurred at school (44 percent), the offender’s residence (41 percent), the victim’s residence (19 percent), in a religious facility (14 percent), or in another residence (12 percent).
Private archives, in contrast, are personal records created for use mainly by the originating author. These are sometimes directed at a narrow known target, such a friend or loved one. Examples of private archives include personal items such as diaries, letters, or journal entries. The internet is now changing what would traditionally be considered a private archive into what is probably better considered a social domain personal archive. For example, some people post videos depicting their (otherwise) private, personal events on YouTube, while others post highly personal information on social media platforms such as Facebook or Instagram.
Research in Action
Online Dream Diary
As a further illustration of a social domain personal archive, one young man posted a detailed description of his dreams on a personal website. Psychologist Jayne Gackenbach from MacEwan University in Alberta, along with her research team, studied a video game player’s 13-year-long online dream diary (consisting of 831 dreams), as well as his daily activity blogs, to see if the reported dream content was consistent over time and whether it corresponded to what is already known about dreams in video game players. In addition, the researchers examined the correspondence between daily blog activity and subsequent dreams to see if prior everyday events were incorporated into dreams. Results for the 447 dreams included in the analysis from the archive showed that the dream content was consistent over time (e.g., similar characters appeared, similar social interactions took place) and there was some incorporation of elements of the daily blog into subsequent dreams. The video game player’s dreams also contained themes consistent with other gamers, including the prevalence of dead and imaginary characters (Gackenbach et al., 2011).[1]
Advantages and Disadvantages of Archival Analysis
Like trace measures, archives are beneficial to researchers largely because they are non-reactive. In addition, archives often provide a low-cost means for researchers to access a multitude of existing records. Since archives can be collected indefinitely, archival analysis is especially suited for longitudinal analysis where pattern and trends can be examined over time.
The main drawback of archival analysis relates to validity because, as with trace measures, selective deposit and selective survival biases may determine who or what ends up in the records and which records have a better chance of persisting over time (Webb et al., 2000). For example, because records are sometimes created for the benefit of an organization or agency (e.g., sales records, annual reports), biases may be built into how the data was collected in the first place. In addition, records may be incomplete, they may get lost, and/or certain records may be destroyed over time. One way to increase validity and lessen the likelihood of errors due to missing data is to use archival analysis in combination with other data collection methods.
Finally, since unobtrusive methods involve means of obtaining evidence indirectly, people are usually unaware that data about them has been used for research purposes, and therefore informed consent was never obtained. While we may learn important insights and historical facts through the analysis of private records such as diaries and letters often found only after people pass on, should this knowledge come at the expense of the privacy of the originator? In many cases it may be difficult to even establish the accuracy of existing documents—especially personal ones such as biographies.
Test Yourself
- What kinds of records are accessible as public archives?
- What are the main advantages and drawbacks of archival analysis?
CONTENT ANALYSIS
Another main source of non-reactive data comes from visual and print-based forms of media, such as television shows, films, photographs, books, and newspapers, which contain messages studied by social scientists about race, class, violence, and gender, for example. Although content analysis can be traced to propaganda techniques employed by the media (e.g., see Lasswell, 1927), it has also been used to examine the meaning of messages in a variety of archival records including messages delivered by the words, phrases, and passages in books, articles, and news stories; in song lyrics; in information found on websites; in representations shown in magazines; and in character portrayals as shown in television commercials, television programs, and major motion pictures. Similarly, while some researchers view content analysis as an objective, quantitative means for looking at message characteristics (e.g., see Neuendorf, 2002), others view interpretations of text as largely an interpretive, qualitative endeavour involving techniques such as discourse analysis or narrative analysis (e.g., see Van Dijk, 1997). Discourse analysis is directed more at how language is used in a social context, while narrative analysis focuses more on stories provided by individuals. It is probably most accurate, at this point, to “say that content analysis has evolved into a repertoire of methods of research that promise to yield inferences from all kinds of verbal, pictorial, symbolic, and communication data” (Krippendorff, 2019, p. 23).
Conducting a Content Analysis
Any number of topics can be studied using content analysis. Popular topics that students in my classes have studied using this method include gender stereotypes, humour in advertising, violence in the mass media, themes in children’s books, sports injuries, cancer resources, and representations of groups in the media. A sample of topics investigated by researchers using content analyses include the following:
- Influencer marketing involving e-cigarettes on social media (Smith et al., 2023).
- Strategies used by the Canadian food and beverage industry to influence food and nutrition policies (Vanderbrink et al., 2020).
- Public presentations of depression on Youtube (Devendorf et al., 2020).
- #cheatmeal images on social media (Pila et al., 2017).
- Canadian newspaper articles and readers’ comments related to schizophrenia (Shigeta et al., 2017).
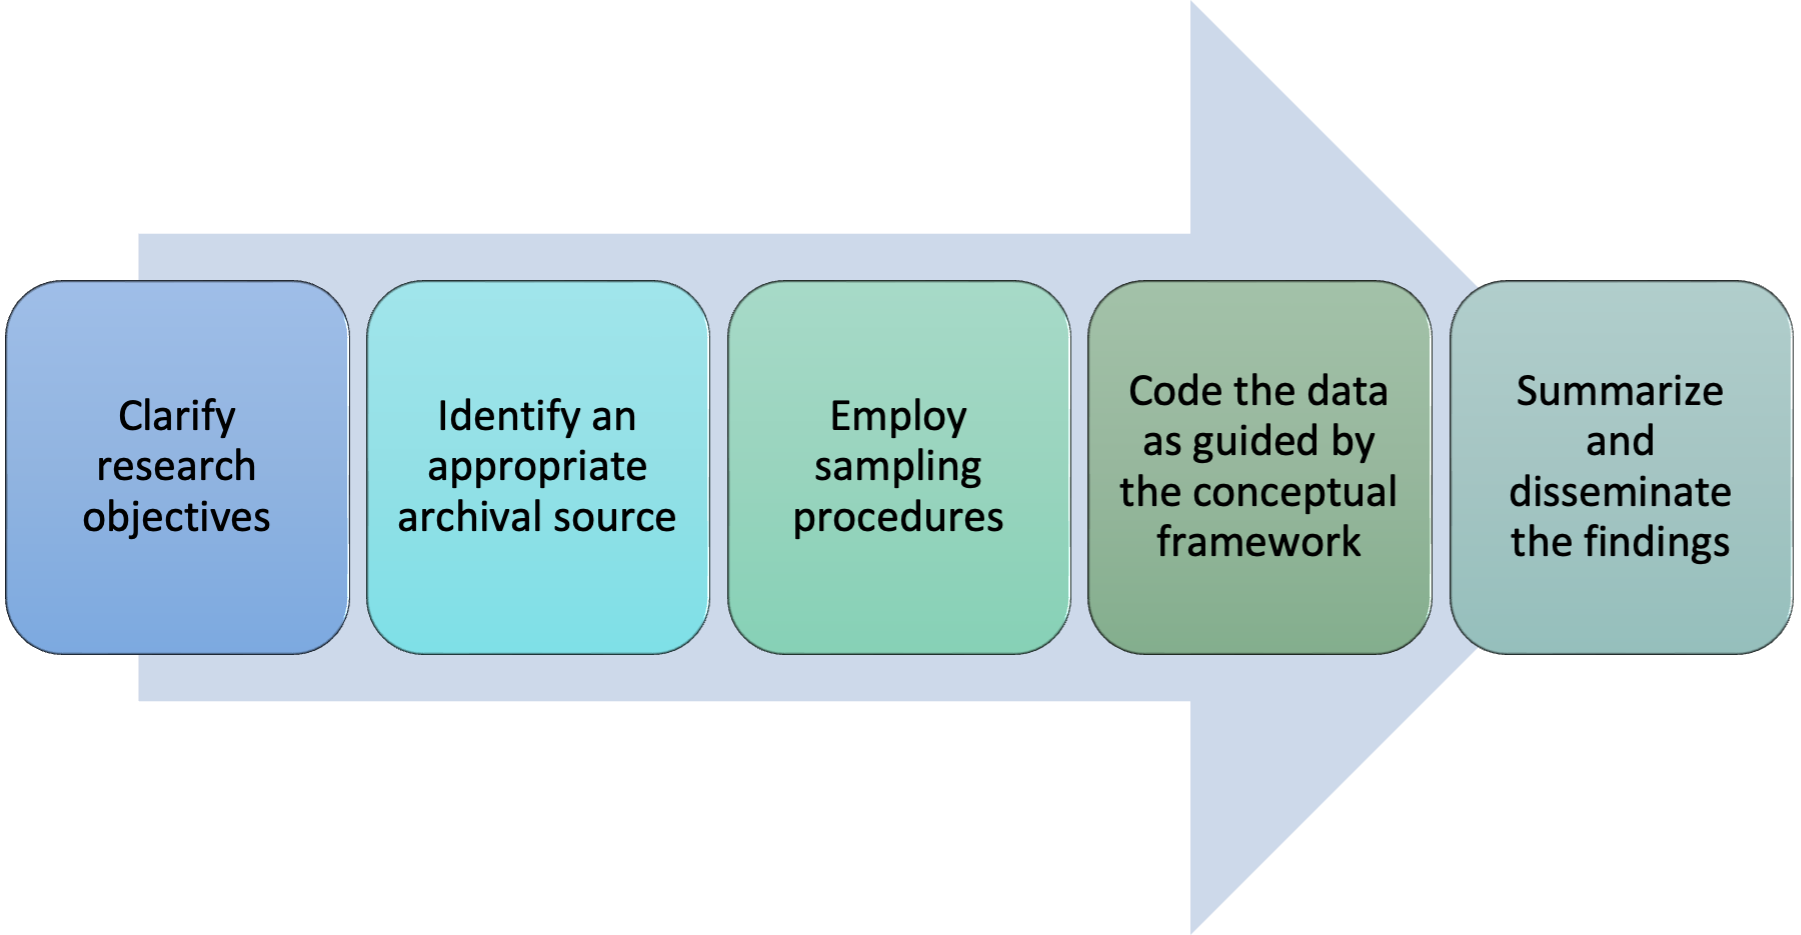
As is the case with any research method, the first step in a content analysis is to clarify the research objectives (see figure 8.1).
Once the objectives for a study are clarified and the researcher has deemed content analysis the most appropriate method for obtaining the data of interest, the next step is to determine the most relevant archival source. For example, a researcher interested in the representation of Indigenous people in the mass media might narrow the project to an exploration of whether Indigenous people are over- or under-represented in media stories involving Canadian crime. Similarly, a researcher might compare how more-or-less liberal news outlets report on stories involving crimes committed by Indigenous youth. My students have selected a range of archival sources for research projects involving content analyses, including local newspapers, national newspapers, primetime television shows, television shows aimed at preschool children, television commercials for children’s products, car magazines directed at young and older audiences, and songs within music genres such as hip-hop. The appropriateness of any given archival source is largely determined by the research questions and objectives. For example, one former student of mine examined representations of Indigenous women in online advertisements for Halloween costumes (O’Dell, 2016). Another student looked at user comments on YouTube about hip-hop/rap music videos featuring sexually objectified depictions of women (Knish, 2018).
After locating an appropriate source, a researcher needs to employ a sampling procedure. Will the study include all available records, a sample obtained using a probability-based technique, or a sample obtained using a non-probability-based technique? Again, it will depend on what the specific study is about. A researcher interested in the portrayal of gender in magazine advertisements might begin by examining a random sample of 10 magazines from the 100 top-selling Canadian magazines, such as enRoute, Sportsnet, HELLO! Canada, and Maclean’s. Within the selected magazines, another simple random sample of advertisements could be obtained. As noted in chapter 4, it is sometimes helpful to distinguish between units of analysis (the magazines) and the more precise units of observation (the advertisements). Once sampling procedures have been worked through, a researcher can begin to code the data.
Coding “is the process of transforming raw data into a standardized form” (Babbie & Edgerton, 2024, p. 207) and it is used to help make sense of the data collected. If a researcher takes a quantitative approach, hypotheses are developed and a precise coding scheme is established according to some conceptual framework in advance of data collection. The researcher defines specific variables for use in analyzing the content of a message to test the hypotheses. For example, a researcher might code the advertisements in magazines to test a hypothesis that females will be more likely than males to be portrayed in gender-stereotyped ways for certain products. The literature is replete with established coding schemes for examining gender portrayals in advertisements. A coding scheme might include the variables sex, type of product sold, role depicted by the main character, and type of portrayal depicted by the main character. Each one of these variables would be precisely defined, such as operationalizing sex as male or female, type of product as food, clothing, service, and so on. Using the coding scheme, the researcher codes each advertisement for each variable and then examines the data collected to see if females are portrayed in gender-stereotyped roles for certain products; for example, as traditional housewives to sell cleaning products. Quantitative content analysis usually involves coding the presence or absence of some event, determining the frequency of a variable, or counting the number of times a word or theme appears in text as described in numbers 1 through 3 on the list of indexes. In each of these cases, the researcher is most likely recording the manifest content, or more obvious, stated content in the message, such as words or phrases contained in the message.
Qualitative content analysis, in contrast, is directed more at understanding the underlying meaning or latent content of a message. It is therefore more likely to involve coding text or images for implied themes and the repetition of constructs, as explained in numbers 4 and 5 on the list of indexes. From a qualitative approach, the researcher begins with a research question (as opposed to a hypothesis) and looks for themes to emerge from the data, which are then reinterpreted using theory, as opposed to coding for specific variables at the onset. For example, in an exploratory study, Mezzana et al. (2012) were interested in learning more about how rock music lyrics portray islands. Theory is still important for developing a conceptual framework that informs the data collection. In this case, the researchers examined what previous researchers had to say about the constructs of “islands,” “islandness,” and “island features” in rock music. However, the purpose was not to test theories but to try to uncover the meaning of islands as related to the lyrics within rock songs. The researchers looked at five decades of rock music—412 songs containing island references—to see how island references were used in the songs. They ended up identifying broader categories (themes) to help qualify the more specific observations. The 24 themes included the notions of loneliness and despair, seclusion, fear, depression, spirituality, love and romance, adventure, and intimacy, among others. The 24 themes adapted from the data and corresponding literature were then further coded under five main meta-themes of space (e.g., seclusion), lifestyle (e.g., adventure), emotions/psychology (e.g., fear), symbolism (e.g., spirituality), and social-political relations (e.g., dominance) (Mezzana et al., 2012).
To summarize, in content analysis, researchers examine messages contained in visual and print media for measurable indicators of more abstract constructs and ideas such as aggression, love, “islandness,” or gender stereotyping. According to Krippendorf (2019, pp. 65–66), these five indexes are typically employed in content analyses:
- The presence or absence of a reference or concept as an indication of some phenomenon of interest. For example, DeJean et al. (2009) examined 608 Canadian health technology assessment reports produced from 1997 to 2006 for the presence or absence of ethics content. They found that only a minority incorporated any form of ethical consideration into the documents.
- The frequency with which a symbol, idea, reference, or topic occurs generally as an indicator of a concept’s importance or emphasis. A content analysis on 150 top-selling video games, for example, revealed a high frequency of the use of profanity (Ivory et al., 2009).
- The number of favourable or unfavourable characteristics attributed to a symbol, idea, or reference that indicates an attitude toward some phenomenon of interest. For example, in Symbaluk and Howell’s (2010) study, students’ posted ratings of instructor attributes at RateMyProfessors.com were coded as positive or negative, depending on the nature of the comment. For example, “knows nothing” would be considered a negative comment about intelligence, while “really knows his stuff” would be positive. The study showed that teaching-award winners receive more positive ratings than research-award winners.
- The kinds of qualifications used in statements about a symbol, idea, or reference that are indicative of the intensity associated with the belief signified by the symbol, idea, or reference. Weitzer and Kubrin’s (2009) content analysis of misogyny in rap music revealed five prevalent kinds of misogyny, including derogatory naming and shaming of women, sexual objectification of women, distrust of women, legitimization of violence against women, and a celebration of prostitution and pimping.
- The repeated co-occurrence of two concepts that indicates the strength of association between them. Couto et al.’s (2022) content analysis of 781 stanzas of songs from the Hot 100 Billboard showed significant co-occurrences between violence and sexual content and violence and degrading content towards women (Couto et al., 2022).
Research in Action
Sexual Messages in Song Lyrics
Researchers at three American universities studied the types of sexual messages found in pop (N = 197), hip-hop (N = 193), and country songs (N = 194) from 2016–2019 (Alexopoulos et al., 2023). Results showed references to sexual demands (e.g., “Strip that down”) and sexual preferences (e.g., “I want it slow”) were the most prevalent forms of sexual messages. There were also numerous references to implied consent (e.g., “I can tell you wanna f***”) posing implications for the reinforcement of stereotypes and problematic sexual scripts involving consent.
Advantages and Disadvantages of Content Analysis
Content analysis, like the other unobtrusive measures, is a great economical and non-reactive means for learning more about the messages conveyed in print and visual forms. Content analysis is free from biases that can lead to distortion in data obtained from participants, such as in a carefully controlled laboratory experiment or with a highly structured survey. Content analysis also maintains the data as it was originally conceived. The songwriter did not write the lyrics for a content analysis, nor did an author write a book for such purposes. As content analysis expert Klaus Krippendorff (2019) puts it, “the chief advantage of the unstructuredness of content analysis data is that it preserves the conceptions of the data’s sources, which structured methods largely ignore” (p. 49). While it may be more difficult to examine text and messages that come in a range of unstandardized formats and types, the structure is not imposed and therefore exists as envisioned by the originator. As a related point, this also means that the “context sensitive” nature of the data can be considered during content analysis (Krippendorff, 2019).
Content analysis is also beneficial because it can be applied to a multitude of topics and it can also manage large amounts of data. For example, Struik and Yang (2021) examined 1228 Reddit posts to learn more about the process people undergo in order to quit smoking. Their findings showed that people used e-cigarettes to help them quit smoking by undergoing a gradual tapering off of nicotine (Struik & Yang, 2021). Since the data for content analysis is archival in nature, there is also the potential for longitudinal analyses (e.g., are there fewer gender stereotypes portrayed in children’s books that were written in the last 20 years compared to books from the 1980s and 1990s?). In addition, since the records already exist, they can be examined and re-examined to increase coder reliability.
A main limitation of content analysis is that the data originated for other purposes and hence it may be biased toward a viewpoint or perspective, as in the case of information contained in the mass media that is produced for profit. Also, it may be incomplete for examining certain hypotheses or questions of interest. Disadvantages of content analysis often relate to questions of validity. Once a coding scheme has been developed and constructs are operationalized into variables that can be readily measured by trained observers, will observers be able to use it properly? Manifest content is much more straightforward to code than latent content since manifest coding generally only involves counting the number of times a word appears or noting the presence or absence of a theme. However, the way in which a message is understood by a coder may not be the way in which the original producer intended the message to be interpreted (Richardson, 2007). Moreover, especially in the case of latent content, different coders are likely to interpret the same message in different ways, resulting in disagreements over what is or is not identified as a major theme in the message and a low inter-rater reliability.
- What are the main steps for conducting a content analysis?
- How does manifest content differ from latent content?
- Which indexes are usually employed in qualitative content analysis?
SECONDARY ANALYSIS
As an alternative to collecting data first-hand directly from participants, as in the case of surveys and experiments, or indirectly, as in the case of trace, archival, and content analysis, researchers can also re-examine existing data using a method called secondary analysis of existing data. Secondary analysis involves the examination of data originally collected by someone other than the researcher for a different purpose. Secondary data can be quantitative or qualitative in nature, as in the case of archived survey data or interview transcripts.
Locating Secondary Sources
Examples of existing Canadian data include official census data and data obtained through national surveys, such as the General Social Survey and the National Population Health Survey. Various government departments and agencies (e.g., Environment Canada, the Correctional Service of Canada), and institutes (e.g., the Canadian Statistical Sciences Institute and the Institute for Social Research at York University) also collect a wealth of information.
Research in Action
Problematic Cannabis Use
Using existing cross-sectional data from the 2013 Canadian Tobacco, Alcohol and Drugs Survey (CTADS), researchers from the School of Public Health and Health Systems and Propel Centre for Population Health Impact at Waterloo University examined problematic cannabis use in Canada (Leos-Toro et al., 2017). The CTADS is a biennial survey conducted by Statistics Canada on behalf of Health Canada (beginning in 2013) that collects information on tobacco, alcohol, and illicit drug use among Canadians 15 years of age and older (Statistics Canada, 2023a). Using measures from the World Health Organization’s Alcohol Smoking and Substance Involvement Screening Test, results showed only 2 percent of those who indicated use in the last three months could be classified as “high risk” for severe health or other problems (Leos-Toro et al., 2017).
Determining the Appropriateness of a Source
It is one thing to know of potential sources of secondary data and quite a different thing to locate one that can be of use for a study. The starting point is always the narrowed research focus. For example, one of my students was interested in a phenomenon in sports known as the “Myth of the Contract Year” where professional athletes purportedly play harder in their final contract year to secure more lucrative future contracts. To determine whether this is the case in hockey, the student examined statistics for hockey players made available by the National Hockey League (NHL). By comparing production measured in points per game (goals, assists) for well-known NHL players averaged over their contract year versus non-contract years, Janke (2012) showed that some players were as productive or even more productive in non-contract years, helping to dispel the myth.
Some sources may appear to be appropriate but may not actually contain the variables needed to answer a specific research question, and sometimes information exists in a format other than what is needed for a specific study. For example, suppose a researcher wanted to test the applicability of Gottfredson and Hirschi’s (1990) general theory of crime for explaining differences in treatment completion rates for sexual offenders using indicators of self-control. In this case, offenders with higher levels of self-control are expected to be more likely to complete treatment, while those with lower levels are less likely to complete treatment. After gaining the necessary ethical and institutional permissions to access what would appear to be an appropriate secondary source (e.g., a data set on Canadian offenders who underwent treatment for sexual offending at a minimum-security institution), the researcher might discover that the data set only contains limited information collected on patients at the beginning and end of treatment. The information the researcher is interested in, such as background characteristics pertaining to early school years, the stability of relationships, and job histories, which would serve as indicators for self-control, might still exist, but it may be contained in individual patient files as notes from various sources (e.g., the head psychiatrist, therapists who regularly interact with the client). How then can a researcher determine if a data set will be appropriate in advance of carrying out the research?
In most instances, a researcher can assess the merit of a potential secondary data set by examining available information that describes the data set, or data sources and methodology used to obtain the data. For secondary data stemming from Statistics Canada, there is published information on the purpose of the survey, the date the data was originally released, questionnaire(s) and reporting guides, description, data sources and methodology, and data accuracy. For example, Statistics Canada conducts a mandatory annual census of all registered Canadian pension plans (RPPs). If you look up “Pension Plans in Canada Survey” at Statistics Canada, you will learn its purpose is to provide information on the terms and condition of RPPs, membership in them, and contributions made by and on behalf of members (Statistics Canada, 2022). Additional information about a data set is sometimes included in a codebook, a listing of variables that details how they were operationalized in the data set. For example, a variable might be “gender” and it could refer to “the behavioural, cultural, or psychological traits associated with a particular sex” (Symbaluk & Bereska, 2022, p. 139). Gender, in the study, might be coded as 1 = male, 2 = female, and 3 = other. A variable such as “offence” might refer to the type of criminal offence committed by someone whose information is included in the data set. A codebook also includes details on how any scales and indexes were constructed and how missing data was dealt with. Note that for a qualitative study, a researcher may be able to access journal notes, audit trails, or other documents that detail the process by which the available data was transformed into it its current format, which could be in the form of words, images, or even artifacts.
In addition to details about the purpose of the data and how it was gathered, a researcher also needs to pay special attention to the data format and structure. The data format usually refers to “the statistical format in which data are saved or stored” (Pienta et al., 2011, p. 18). For example, quantitative data is likely to be in a numerical format amenable to statistical analysis using a software package designed especially for the social sciences, such as IBM SPSS Statistics. Qualitative data is more apt to be a collection of visual or textual statements (see chapter 9 for more information on how verbal information collected in interviews is turned into data). The data structure refers to “the number and organizational nature of distinct files that compose a data collection and the relationship among those data” (Pienta et al., 2011, p. 18). For example, secondary data is often contained in a single file in a table with rows of information that illustrate variables by participants, as shown in table 8.1. Each row except for the first row corresponds to the information from one case.
| Case | Legal Sex | Age | Offence | Risk |
|---|---|---|---|---|
| 1 | 1 | 23 | 1 | 5 |
| 2 | 1 | 21 | 4 | 1 |
| 3 | 2 | 20 | 2 | 1 |
| 4 | 2 | 19 | 3 | 2 |
| 5 | 1 | 20 | 2 | 4 |
| 6 | 1 | 19 | 2 | 3 |
Statistics Canada as a Leading Data Source
Statistics Canada regularly collects data on virtually all aspects of Canadian life of interest to federal government agencies. For example, pertaining to criminal justice, Statistics Canada conducts various annual surveys such as the Adult Correctional Services Survey, the Integrated Criminal Court Survey, and the Uniform Crime Reporting Survey (Statistics Canada, 2024d). The Adult Correctional Services Survey collects data from all institutions in the provincial and federal correctional systems on new admissions, conditional releases, and financial/human resources. The Integrated Criminal Court Survey collects information on criminal court appearances and charges. The Uniform Crime Reporting Survey is managed by the Canadian Centre for Justice Statistics, a division of Statistics Canada that is responsible for collecting national data on crime (Statistics Canada, 2023c).
Police agencies throughout the country use the Uniform Crime Reporting Survey (UCR) to report crime statistics in a standard way for criminal offences. Since 1962, the UCR has collected information on the number of criminal incidents, the clearance status of those incidents, and the persons charged. In 1988, a second survey was created (called the UCR2) to obtain additional details on the characteristics of incidents, victims, and accused (Statistics Canada, 2023c). The UCR and UCR2 provide available data on close to 100 different offences. See table 8.2 for summary information on the number and type of homicides committed in Canada between 2018 and 2022. Crime data can be re-examined to test theories, look for patterns and trends, and explore relationships among variables.
| 2018 | 2019 | 2020 | 2021 | 2022 | |
|---|---|---|---|---|---|
| All methods | 665 | 689 | 764 | 796 | 874 |
| Shooting | 253 | 264 | 279 | 298 | 343 |
| Stabbing | 183 | 214 | 239 | 243 | 281 |
| Beating | 122 | 102 | 135 | 133 | 143 |
| Strangulation | 37 | 31 | 37 | 34 | 38 |
| Fire* | 10 | 16 | 9 | 13 | 17 |
| Other** | 33 | 44 | 36 | 35 | 29 |
| Methods unknown | 27 | 18 | 29 | 40 | 23 |
| Notes: Homicides include Criminal Code offences of murder, manslaughter, and infanticide. If multiple methods against one victim are used, only the leading method causing death is counted. Thus, only one method is scored per victim. *Fire includes burns and suffocation. **Other methods include drug overdose, poisoning or lethal injection, exposure or hypothermia, abusive head trauma, deaths caused by motor vehicle impacts or collisions, and neglect or failure to support life. | |||||
It is important to note that Canadian crime data is the end result of crimes that were recorded as such by the police, as opposed to a “true” measure of the amount of crime committed, since many crimes go undetected, many go unreported, and many are not classified as crimes after being reported. Furthermore, there are concerns about how particular crimes are counted. For example, in the case of multiple offences committed at the same time, only the most serious offence is recorded. In addition, the data obtained by police may be shaped by other factors, such as policy decisions, policing practices, and public concerns (Evans, 2020). To try to gain a more accurate estimate of the true amount of crime, criminologists and other interested parties typically supplement official crime statistics with other measures, such as information obtained on surveys completed by offenders and/or victims of crime.
Advantages and Disadvantages of Secondary Analysis
Secondary analysis is an inexpensive and time-saving method for looking at patterns and trends in official data, such as the information collected through surveys conducted by Statistics Canada. In addition to being non-reactive, secondary analysis may have built-in safeguards, including the protection of privacy pertaining to how the data was collected in the first place. Information collected in Statistics Canada surveys, for example, is confidential. That is, Statistics Canada will not release information (even to the Royal Canadian Mounted Police) that would identify individuals with the responses provided. Furthermore, the data collected is reported and released in aggregate form as grouped data. Secondary analysis is especially suited to longitudinal research since the data from multiple surveys can be examined and compared over time.
One of the main drawbacks of secondary analysis is that the data was collected for purposes other than the present research study. This means the data may be incomplete or not contain the essential variables of interest for the secondary analysis. Moreover, except for sources such as Statistics Canada, there may be no way to determine how the data was originally collected, calling into question whether ethical safeguards were put into place and whether the measures are reliable and valid.
Activity: Secondary Analysis
Research on the Net
Open Data Pilot Project
As an effort to make Canadian data more available for commercial and non-commercial purposes, the Government of Canada launched its first-generation Open Data Portal in 2011, launched its second-generation Open Government Portal in 2013, and is now part of an international Open Government Partnership with 55 other governments (Open Government Partnership, 2024). Open Data allows access to a catalogue of federal government data sets freely available to users for secondary analysis. Tens of thousands of data sets can be accessed using key word search terms such as roads, immigration, law, or health.
Test Yourself
- What is secondary data analysis?
- Which agency serves as the main source of secondary data on virtually all aspects of Canadian life?
- Why does secondary data analysis pose ethical concerns?
VIRTUAL RESEARCH AND DIGITAL RESEARCH
Given the limitlessness of the internet today, this chapter concludes with a brief discussion of internet-based research methods and data that may fall within an unobtrusive or reactive realm, that may include public or private sources of information, and that may or may not require prior ethical approval. The internet has dramatically changed the way researchers conceptualize the social world, and it continues to shape the way social researchers conduct research. First, the internet is a “social space” that offers an endless array of social opportunities and interactions that have meaning for individuals who create virtual selves, participate in online communities, and engage with social media platforms (Hine, 2013). Historically, social researchers have employed traditional methods such as ethnographic fieldwork in online environments (called virtual ethnography) to study individuals or virtual selves created by individuals (Hine, 2000; Pink, 2001). The internet also includes digital technologies that expand the reach of traditional methods into virtual domains such as virtual experiments, online focus groups, or interviews conducted using email. Moreover, the internet contains a wealth of primary and secondary visual data sources as objects of study, in the form of pictures, videos, and graphics that enable researchers across disciplines to examine cultural artifacts, social issues, interactions, and consumption patterns as they exist online (Ardévol, 2012). Networking services such as X or Facebook have amassed such popularity that their “big data” sources have been mined for myriad purposes and have grown beyond what can be adequately examined with more traditional research methods. Consequently, the internet has responded by making available digital tools for examining social issues as digital data, using even more specialized technology. For example, software such as DiscoverText can be used to help sort and analyze textual data in the form of public comments and statements made in blogs and posted to sites such as X (Discovertext, 2024).

Appreciating that the internet can be used in various ways as a source of data or as a facilitator for carrying out research, it should be becoming apparent that previous distinctions made between reactive and non-reactive forms of research, and between private versus public forms of information, begin to blur. Are an individual LinkedIn user’s posts considered private information, shared information among a social network, or a form of primary data that exists in the public domain? Given one’s ability to alter a virtual self, is an online representation best considered reactive or non-reactive? Even the distinction between digital forms of information as data sources versus data gathering methods is difficult to maintain if we consider digital media as the framework for both, as captured by Sarah Quinton and Nina Reynold’s (2018) notion of digital media, which “encompasses all computer-mediated internet and digitally enabled media through which data may be collected, shared and analyzed, including, for example, blogs, online forums, QR codes, online questionnaires, emails, Skype interviewing, YouTube material, Instagram messages, [X] content, geo-location and internet navigation” (p. 10). Alongside the internet’s potential for ever-increasing research opportunities, the ethical challenges stemming from the use of digital media are similarly expansive, particularly in terms of potential risks to individuals and privacy considerations, and ethical issues arise at all stages of the research process, from the nature of the research and its aims, to how the data is conceptualized, to whether and how participants are involved in the research, to how the data is collected and analyzed, and to what is done with the data and findings that result from the study (e.g., see Quinton & Reynolds, 2018).
Test Yourself
- In what ways is the internet a source of data for social researchers?
- In what ways is the internet a facilitator for carrying out social research?
CHAPTER SUMMARY
- Define unobtrusive method and explain what is meant by reactive and non-reactive research methods.
Unobtrusive methods are strategies in which the researcher examines evidence of people’s behaviour or attitudes rather than interacting directly with those being studied. A reactive method is one that directly involves a research participant, who may react to being in a study based on how questions are asked (e.g., in a survey) or due to the presence of a researcher (e.g., in an experiment). Non-reactive methods are unobtrusive because the data is obtained without participant involvement. - Explain what physical trace analysis is used for and differentiate between erosion and accretion measures.
Physical trace analysis is the study of products of past behaviour that provide insight into patterns and trends. Erosion measures are signs of selective wear and tear that tell us about human use and non-use (e.g., worn paths that denote desired walkways). Accretion measures are product deposits left behind based on prior activity, such as garbage or graffiti. - Differentiate between public and private archives and note a main advantage and disadvantage of archival analysis.
Public archives are public records prepared specifically to be examined by others, such as annual reports or attendance records. Private archives are created for personal use and include letters and diaries. As with all unobtrusive methods, archival measures are beneficial because they are non-reactive. In addition, archival records are economical and lend themselves well to longitudinal analysis. Drawbacks to this method include selective deposit and selective survival biases, as well as a potential lack of informed consent. - Define content analysis and outline the steps for conducting a content analysis.
Content analysis is a repertoire of methods that allow researchers to make inferences from all kinds of verbal, pictorial, symbolic, and communication data. Steps for carrying out a content analysis include clarifying research objectives, identifying relevant archival sources, employing sampling procedures, coding data in accord with conceptual frameworks, and summarizing and reporting on the findings. - Explain what secondary analysis of existing data entails, identify key sources for secondary data analysis, and note a main advantage and disadvantage of secondary data analysis.
Secondary analysis of existing data involves an examination of data originally collected by someone other than the researcher for a different purpose. Key sources for secondary data analysis include official census data and data obtained through national surveys, as well as data collected in research centres and institutes. Statistics Canada is the main federal government source for secondary data on most topics involving Canadians. One advantage of using data from Statistics Canada is that it includes built-in privacy and informed consent safeguards from when the data was collected. However, the data was collected for other purposes and may be incomplete for the purposes of the current study. - Define digital media and explain how the internet has changed the nature of social research and the methods used to study it.
Digital media refers to all computer-mediated internet and digitally enabled media through which data can be collected, shared, and analyzed. The internet both provides sources of information for social research and entails means for studying it. For example, online communities are subcultures studied by ethnographers, and virtual ethnography is an approach used to study online cultures. The internet also contains tools, such as software that aids in the collection and analysis of online data.
RESEARCH REFLECTION
- Suggest a physical trace measure that could be employed as one of the main variables for each of the following research topics:
- Students’ use of food service providers on campus
- Students’ typical commute patterns on campus
- Students’ food consumption on campus
- Students’ preferred study space on campus
- Suggest an appropriate archival or secondary data source for each of the following research topics:
- Popular vacation spots
- Fashion trends
- Crime statistics
- Canadian documentaries
- Suppose you wanted to conduct a content analysis on the portrayal of gender in popular general-audience-rated movies.
- First, search for and list 10 classic movies that are rated G, for a general audience, and are suitable for younger children (e.g., The Lion King, Toy Story, Finding Nemo, and The Little Mermaid).
- Now consider who or what is likely to constitute the main character in one of these movies. If you had to categorize the main character as one of only five different “types,” what would the types consist of to ensure that your categories were mutually exclusive and exhaustive? For example, would all animals of any kind, such as mammals, birds, and fish, be classified together?
- Come up with one research question on gender you could examine in a content analysis of popular G-rated movies.
- Refer to Smith, S. L., Pieper, K. M., Granados, A., & Choueiti, M. (2010). Assessing gender-related portrayals in top-grossing G-rated films. Sex Roles, 62, 774–786. How were the main characters operationalized in this study?
LEARNING THROUGH PRACTICE
Objective: To learn how to code data for a content analysis
Directions:
- Locate and examine a few online dating sites, such as eHarmony.ca or Zoosk.com.
- Write down several variables located on the site, such as pronouns, hobbies, and occupation.
- Develop three research questions you could examine based on the information provided at the site. For example, how do women seeking relationships with men describe themselves on the site?
- What exactly would you need to code to explore your research questions?
- Choose one research question, make up a coding sheet that lists the central variables, and then try coding 10 relevant profiles at the selected site.
- Did you employ a sampling procedure to obtain relevant profiles? Explain.
- Are your initial findings what you expected? Why or why not?
RESEARCH RESOURCES
- For a comprehensive resource on social media, see Benson, V. (Ed.). (2023). Handbook of social media in education, consumer behavior, and politics. Elsevier.
- For a comprehensive overview of content analysis, see Faggiano, M. P. (2022). Content analysis in social research: Study context, avenues of research, and data communication strategies. Brill.
- For a content analysis based on latent messages in song lyrics, check out de Guzman, A. B. and Laguilles-Villafuerte, S. (2021). Understanding getting and growing older from songs of yesteryears: A latent content analysis. Educational Gerontology, 47(7), 312-323.
- To learn about ethical considerations in secondary analysis, refer to chapter 22 in Gray, D. E. (2022). Doing research in the real world (5th ed.). Sage.
- Note that in Gackenbach et al.’s (2011) study, informed consent was obtained from the young man who posted his dreams and daily activities. ↵
Strategies in which the researcher examines evidence of people’s behaviour or attitudes rather than interacting directly with those being studied.
The remnants, fragments, and products of past behaviour.
Patterns of selective use based on wear.
Patterns of selective use and non-use based on accumulation.
The study of behaviour based on the analysis of waste.
A form of visual communication, usually illegal, involving the unauthorized marking of public space by an individual or group.
A bias resulting from the greater likelihood of establishing certain physical traces over others.
A bias resulting from the greater likelihood of certain physical traces persisting over time.
Historical documents, records, or collections detailing the activities of businesses, agencies, institutions, governments, groups, or individuals.
Public records that are prepared specifically to be examined by others.
Personal records that are usually directed at a small known target or are produced only for use by the originating author.
Personal information that is posted to public arenas using social media such as Facebook or Twitter.
A repertoire of methods that allow researchers to make inferences from all kinds of verbal, pictorial, symbolic, and communication data.
The process of transforming raw data into a standardized form.
Content stated in the message itself.
Implied meaning inferred by the message.
Examination of data originally collected by someone other than the researcher for a different purpose.
A detailed listing of how each variable is coded in the data set, along with information on the methodology underlying the original study.
The statistical format in which data are saved or stored.
The number and organizational nature of distinct files that compose a data collection and the relationship among those data.
All computer-mediated internet and digitally enabled media through which data can be collected, shared, and analyzed.
