Survey Results
Survey Results
Question One: What is your Age Range? (N=72)
Question number one determined the age ranges of the survey participants. Six participants over the age of 25 did not meet the requirements for the target demographic (18–24 years) and their survey results were removed from the data collection. The participants who were removed indicated their ages as the following: 25, 25, 25, 28, 30, and 27. The ages of eligible participants varied slightly; the most frequent age bracket was 26 participants (39.4%) aged 23–24, 23 participants aged 21–22 (34.8%), and the least frequent age bracket was 17 participants aged 18–20 (25.8%). The results of this question were crucial in determining the age demographics laid out in the research question; “young adults” was previously defined as those 18–24 years of age. Question one also shows what audiences by age the survey reached and what age groups showed the most interest in participating in this research topic. The response with the most participants was the 23–24 age group with 26 participants (39.4%) showing the most interest in participating in the research topic.
Question Two: What are your Preferred Pronouns? (N=66)
The results of the survey’s second question were not necessary for the research study and data analysis. These results were used to appropriately address participants that consented to participate in phase two of the research study. Out of 66 survey respondents, 55 answered question two. Forty-five of those responses identified their preferred pronouns as “She/Her”, and 20 of the responses identified with “He/Him.” As such, there was a higher representation of female-identifying participants (69.2%) than male-identifying participants (30.8%). Two alternate options were available for participants to choose from: “They/Them” and “Prefer not to answer”. No participants selected these responses (0%). The one participant that did not answer question two may not have felt comfortable choosing either option available.
Table 2
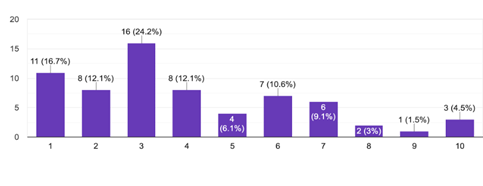
Question Three: What District of the Greater Edmonton Area do You Live In? (N=66)

Question three of the survey was used to show where the participants reside in Edmonton. The geographic results of this question determined the eligibility of respondents according to the target demographic defined by the research question: “Edmonton area.” The results show that out of 66 participants, the majority of 16 participants reside in the South-West district of Edmonton (24.2%) and the second-largest representation closely followed with 12 participants from the Downtown district (18.2%). Four of the districts average closely in the middle: eight from the West (12.1%), seven from the North-East (10.6%), six from the North-West (9.1%), and six from the South-East (9.1%). Three districts with equal-lower representation: three from Sherwood Park (4.5%), two from Saint Albert (3%), as well as two from Spruce Grove (3%). Four districts had only one respondent: Beaumont (1.5%), Stony Plain (1.5%), Fort Saskatchewan (1.5%), and Gibbons (1.5%).
Figure 2
Question Four: Please Select All That Apply Regarding Your Employment Status. (N=66)
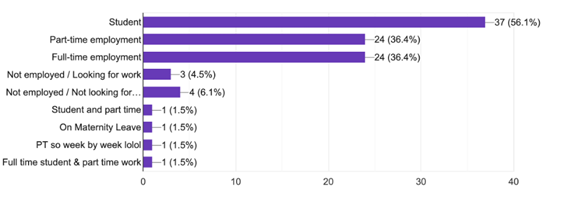
For question four, there were five initial response options, as well as the opportunity to add an option that the participants deemed more applicable. This was used by some participants to group their responses instead of selecting all that applied. In the following analysis those responses were added to the corresponding answers. Thirty-nine out of 66 participants responded with the employment status “Student” (59.1%); This includes 37 participants who selected “Student”, as well as one student who wrote “Student and part time” and one who wrote “Full time student and part time work”. The number of participants that responded with an employed status reported that 26 overall work part-time (39.4%)—again, this includes the two participants who wrote “Student and part time” and “Full time student and part time work”—and 24 work full-time (36.4%). Three participants responded that they were not employed and looking for work (4.5%), and four reported that they were also not employed but were not looking for work (6.1%). One participant responded with their status as “On Maternity Leave” (1.5%). The responses to this question give the background on the participants’ average daily schedules and their availability to access social media.
Question Five: Do You Have a Social Media Account(s)? (N=66)
All 66 participants indicated that they have one or more social media accounts.
Question Six: On Average, How Often Do You Visit Social Media? (N=66)
Of the 66 responses, 40.9% (27) of the participants use social media every hour, 33.3% (22) use it every 30 minutes or more, and 25.8% (17) use it every couple of hours. None of the respondents indicated that they use social media “once a day” or “once a week or less” as the options presented. This confirms that the majority of young adults in the Edmonton region are active on social media platforms daily, which contributes to some of the excessive habitual behaviours seen throughout the study.
Table 3
Question Seven: When Do You Find Yourself Using Social Media The Most? (N=66)
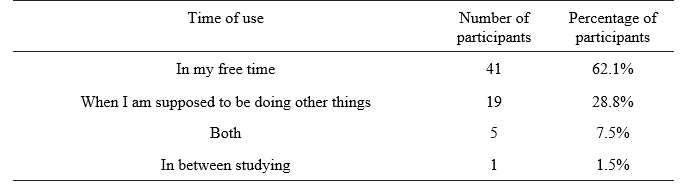
Table 3 shows that 62.1% (41) of all participants use social media in their free time, 28.8% (19) use it when they’re supposed to be doing other things, and 7.5% (5) indicated both. The remaining 1.5% (1) was from a respondent indicating they use social media most in between studying. The researchers can infer from these percentages that while most young adults use social media excessively, this occurs mainly during leisure time for the majority.
Figure 3
Question Eight: What Do You Use Social Media for the Most Often? Select All That Apply. (N=66)

In question eight, participants were asked to select all that apply when it comes to what they used social media for most often. The most selected option was 54 (81.8%) participants, indicating that they mostly use social media to pass time or overcome boredom. The least popular option was the use of social media to ‘share personal moments with my network/public’ only selected by 24 (36.4%) of respondents. A good option for this question would have been “For school and/or work purposes” because question 15 indicated that a large number of respondents (60.6%) also use social media for both work and school or one or the other.
Figure 4
Question Nine: On a Scale of Very Often to Never, How Often Do You Find Yourself Using Social Media Longer Than Intended? (N=66)

Figure 4 asks participants how often they find themselves using social media longer than intended—one being very often and five being never. The highest-ranking answer was “very often,” with a total of 18 participants (27%), choosing this. Although, the rest of the participants were evenly distributed in the other choices. Averaging about 21–22% for options two (14 responses), three (15 responses), and four (14 responses). Forty-seven (71.2%) participants frequently use social media more often than intended—this number encompasses the first three response options on the scale. The variety in these answers shows that a clearer question should have been asked. What each number meant, or even a simple three options (very often, sometimes, and never) could have been added. This may have allowed the receipt of more decisive answers to provide a clear conclusion to this question.
Question Ten: Has Social Media Become Significant to your Daily Routine? (N=66)
Eighty percent (80%) of users answered yes to social media becoming a part of their daily routine. This supports the observation that young adults have become reliant or habitual in using their social media each day, whether it be to send messages, check on updates of friends or the world, or even just to take up time in the slow parts of their day.
Question Eleven: What Device Do You Use Most Often to Access/Use Social Media? (N=66)
Almost all participants (65 out of the 66 responses) said they used cell phones to access social media throughout their day. This shows us that having growing technology and the ability to access social media with the click of a button creates an easy access environment for users to become habitual with checking their phones, messages, media, status updates, etc.
Table 4
Question Twelve: What Time of the Day Do You Find Yourself Using Social Media the Most? (N=66)
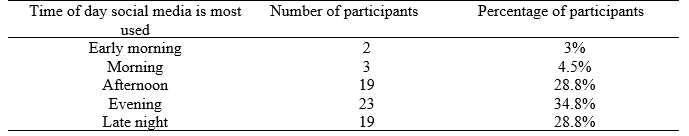
Participants were close to being evenly distributed between using social media mostly in the afternoon (28.8%), evening (34.8%), and late-night (28.8%). This suggests that as people finish what they need to get done for the day, they have excess time to spend on social media.
Question 13: How Do You Feel Your Social Media Use Has Changed Since the Covid-19 Pandemic? (N=66)
Over half of the 66 survey participants indicated that they use social media more often than before the pandemic—56.1% (37/66). Very few indicated that they use it less often than before—3% (2/66)—and less than half—40.9% (27/66)—indicated that they use it the same amount as before. This is important because it shows that the data concerning social media addiction that is presented may differ from prior years due to the onset of the Covid-19 pandemic in 2020.
Figure 5
Question 14: How Do You Feel Your Social Media Use Has Changed Since the Covid-19 Pandemic? (N=66)
For question 14, participants were asked to rank how they feel when they do not have access to social media. The beginning of the rank (1) is no discomfort, and the end of the rank (10) is strong discomfort. The majority of respondents indicated that they had either no discomfort or varying levels of low discomfort when they do not have access to social media. To be precise, 65.1% (43/66) of respondents ranked themselves below the halfway point (no to little discomfort), 28.7% (19/66) ranked themselves above the halfway point (strong discomfort), and 6.1% (4/66) ranked themselves in the middle (medium discomfort) (see Figure 5). Forty-seven (71.2%) participants feel little to no discomfort when they cannot use social media—this number encompasses the first five response options on the scale.
Question 15: Do You Use Social Media For Work/School Purposes? (N=66)
Question 15 asked participants what they typically use social media for. Out of 66 respondents, 39.4% (26/66) indicated that they do not use social media for work or school purposes, 30.3% (20/66) indicated that they use social media for work and school needs, 18.2% (12/66) use it only for work needs, and 12.1% (8/66) use it for school needs. In total, 60.6% (40/66) of participants use social media for either both work and school or one or the other. This is significant because it shows that not all social media use is up to the participant, some of it is necessary for other life responsibilities and cannot all be attributed to personal entertainment or communication purposes.
Social Media Screen Time Log Results
Table 5
Social Media Screen Time Data: iPhone Participants (N=8/66)
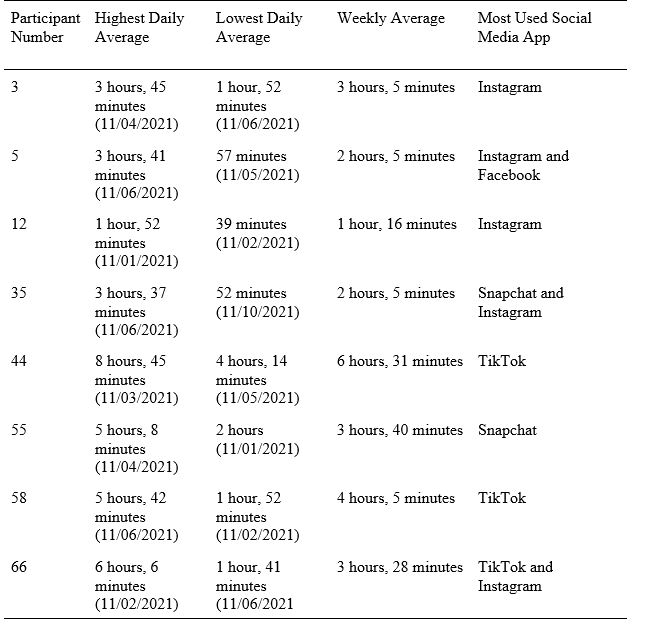
Table 6
Overall Screen Time Data: Android Participants (N=2/66)