Summary of Data
Summary of Data
Figure 1
Question 1: What is your age range?
(Answered by 15 participants)
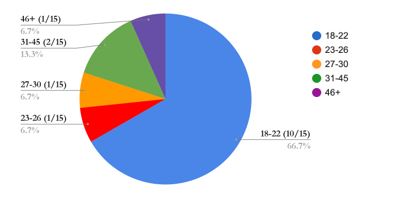
Of the students questioned in the survey, 66.7% were between the ages of
18–22 (10 participants). Additionally, 13.3% (two participants) were in the age range of 31–45.
The age ranges of 23–26, 27–30, and 45+ each represented 6.7% (one participant) of total responses. Based on these statistics, the majority of students surveyed were in the 18–22 age range with the second-highest majority being between 31–45.
Figure 2
Question 2: How many courses do you take in an average semester?
(Answered by 15 participants)

Most of the students surveyed reported carrying close to a full course load. Out of 15 participants, just over 93% (14 participants) said they took either four or five courses in an average semester. Those two options were tied for the most popular answer with 46.7% each (seven participants). One outlier in the data was one student who responded that they take three courses in an average semester.
Figure 3
Question 3: How many hours do you spend doing schoolwork outside of class per day?
Question 5: How many hours per day do you spend participating in your hobby/hobbies?
(Answered by 15 participants)
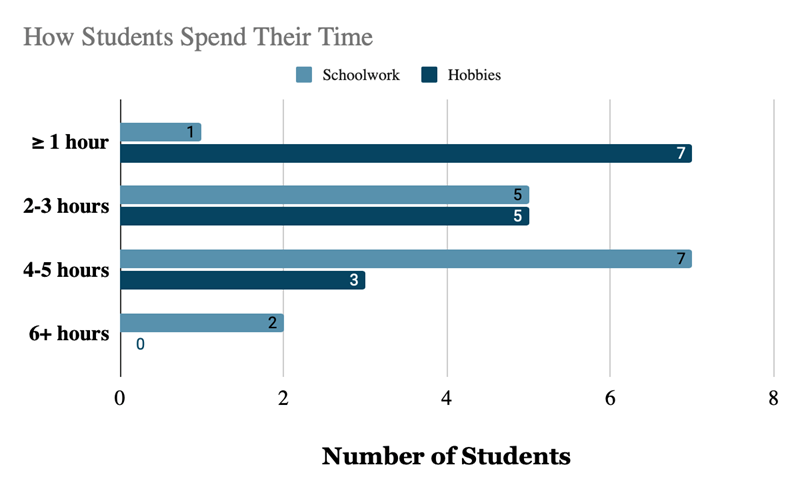
The data above compared the amount of time students spent on schoolwork to participating in hobbies. The most popular response to question three indicated that seven participants spent between four and five hours a day doing schoolwork. Five participants reported spending between two and three hours on schoolwork per day. Only two participants reported spending more than six hours a day doing schoolwork. Finally, just one participant mentioned spending less than or equal to one hour per day doing schoolwork.
In comparison to the amount of time spent working on school assignments or projects, many students reported spending significantly less time enjoying their hobbies. Question three established that seven participants spend four to five hours per day on schoolwork, and the same percentage reported that they spend less than or equal to one hour participating in their hobbies. Additionally, five participants reported spending two to three hours on their hobby/hobbies, while only three participants said they spend four to five hours per day enjoying their hobby/hobbies.
Figure 4
Question 4: What hobby/hobbies do you participate in most frequently?
(Answered by 15 participants)
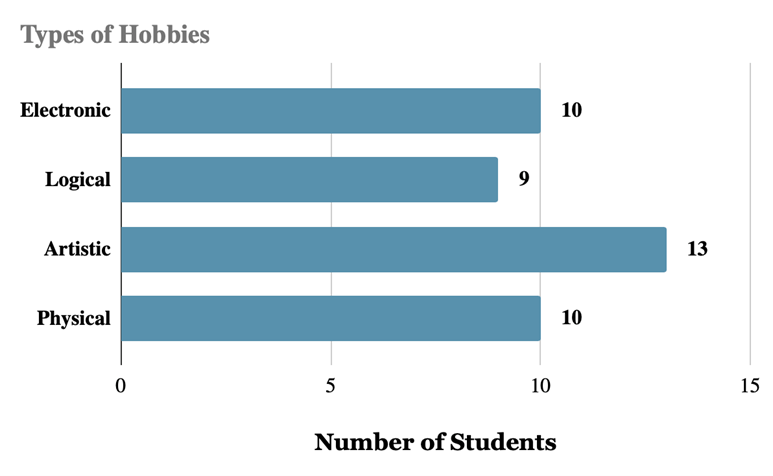
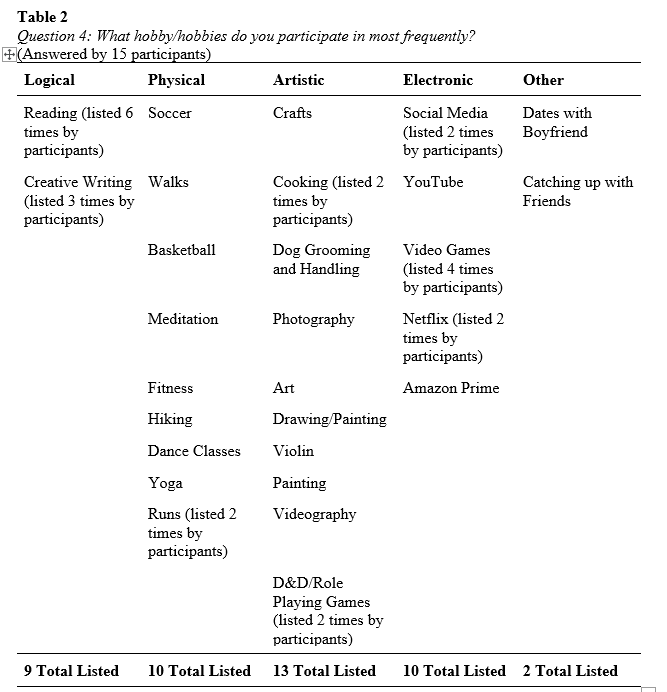
Question four was open-ended to provide participants the opportunity to list the hobby/hobbies they participate in most often. Therefore, some participants listed more than one hobby. The hobbies listed were classified into the four main hobby types with an additional ‘other’ hobby type (see Table 2). Among the four types of hobbies, the largest number of activities fit under the artistic type with 13 hobbies. The electronic and physical hobby types were tied for second with 10 hobbies each. Lastly, the logical type had the least amount of hobbies mentioned with a total of nine. In terms of the specific hobbies listed, the most popular hobby among the students was reading, which was listed six times. Video games came in a close second with four mentions.
Figure 5
Question 6: How do you engage in the subculture around your chosen hobby/hobbies? (Check all that apply)
(Answered by 15 participants)
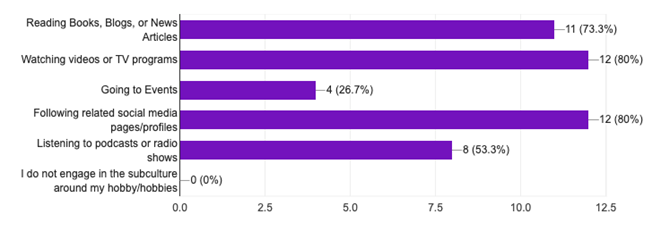
The most popular way that students enjoyed the subculture around their hobbies was through watching TV programs and videos or following related social media accounts. Both options were selected by 80% of the students (12 participants). Another option that was commonly selected was reading books, blogs, or news articles with 73.3% (11 participants) reporting reading as a way to engage with their hobby on a deeper level. Other subculture elements selected were 53.3% (eight participants) mentioning listening to podcasts and 26.7% (four participants) enjoying attending related events. The answers to this question demonstrated that each student engaged with the subculture of their hobby/hobbies, mostly through digital means.
Question 7: Based on your answer to question 6, how many hours do you spend engaging in the subcultures(s) of your hobby/hobbies?
(Answered by 15 participants)
The majority of participants (10 participants) answered that they spend less than or equal to an hour participating in the subculture of their hobby/hobbies. One-third of students (five participants) said they spend two to three hours engaging in the subculture(s) of their hobby/hobbies. While every student acknowledged participating in the subculture around their chosen hobby/hobbies, that participation was far more limited than time spent doing schoolwork or enjoying the hobby itself.
Table 3
Question 8: Describe your relationship with your hobby/hobbies.
(Answered by 14 participants)
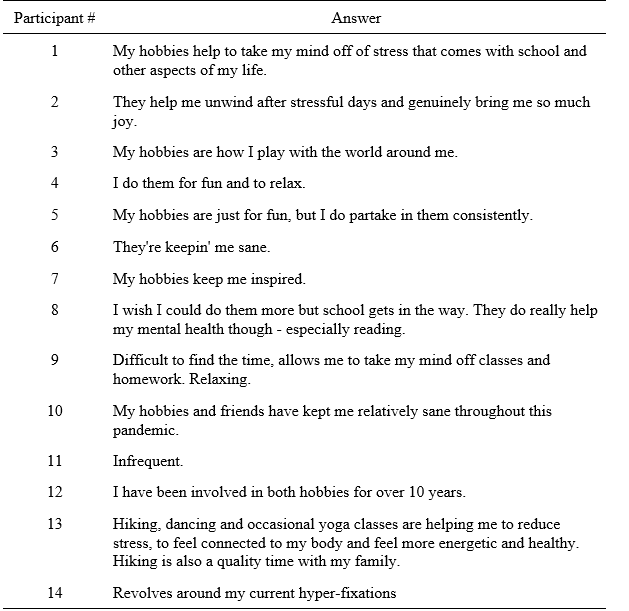
Since question eight was open-ended, participants could skip the question if they chose to. One person chose not to answer this question, so only 14 responses were collected for question 8. Just over 78% of students (11 participants) mentioned some form of positive relationship with their hobbies, using words such as “relaxing,” “fun,” and “unwind”. Many of the answers listed above connect hobbies as an outlet for dealing with stress (see Table 3).
Figure 6
Question 9: Since the beginning of the Covid-19 pandemic (W.H.O. declared Covid-19 a worldwide pandemic in March 2020) have you increased the time spent with your selected hobby/hobbies?
(Answered by 15 participants)

Since the beginning of Covid-19, 40% of students (six participants) reported that they saw no increase in time spent with their selected hobby/hobbies. One-third of the students (five participants) said they have spent an extra two to four hours on their hobby/hobbies during the pandemic. Lastly, 26.7% (four participants) said they have increased their participation in their favourite hobby/hobbies since March of 2020.
Table 4
Question 10: What is bringing you joy today?
Question 11: What is bringing you stress today?
(Answered by 14 participants)
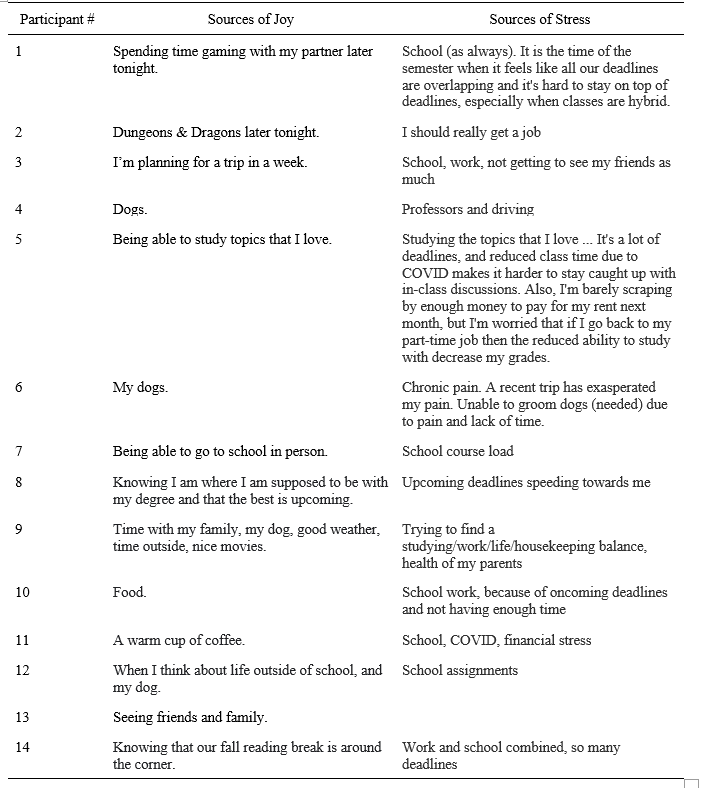
Hobbies were unanimously established as a source of joy among the students surveyed in question 15; however, three participants actually mentioned their chosen hobby/hobbies when asked what brings them joy in question 10. Instead, responses ranged from food and coffee, to trip planning, to spending time with loved ones. Few participants had similar answers to one another, showing that sources of joy can vary from person to person more than stressors. Additionally, some of the answers provided could reflect what brought participants joy on the specific day they answered the question while other answers could reflect what brought participants joy during the more general time period around the research.
School/studying was represented in the responses of 11 participants as a primary source of stress (see Table 4). Other stressors listed were financial and work-related, usually in combination with school. Considering the target demographic, school was an unsurprisingly common stressor. The data from question eight established hobbies as an important element of a student’s lifestyle to manage the stress they experience from school.
Question 12: Does your hobby/hobbies contribute to your stress?
(Answered by 15 participants)
Two-thirds of the total participants (10 participants) said their hobby/hobbies do not contribute to their stress. Only 33.3% (five participants) acknowledged stress resulting from their hobby/hobbies.
Figure 7
Question 13: If you answered “yes” to question 12, how has your hobby/hobbies related to your stress? (select all that apply)
(Answered by five participants)
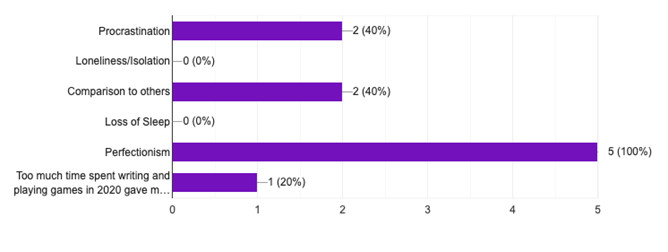
Since only five of the 15 students reported that their hobbies contribute to their stress, only five people answered question 13. Everyone who did respond to this question identified perfectionism as the main source of stress coming from their hobby/hobbies. Forty percent (two participants) reported that procrastination and comparison to others from their hobby/hobbies brought them stress as well. No one reported a loss of sleep or loneliness as a contributor to their stress; however, one person did respond to the “other” option by mentioning that spending too much time on their hobbies caused an injury that still results in physical pain.
Question 14: Do your hobbies bring you joy?
(Answered by 15 participants)
Out of the 15 students surveyed, this question was unanimous: 100% of participants said yes, their hobbies bring them joy.
Figure 8
Question 15: If you answered “yes” to question 14, how has your hobby/hobbies brought you joy? (select all that apply)
(Answered by 15 participants)
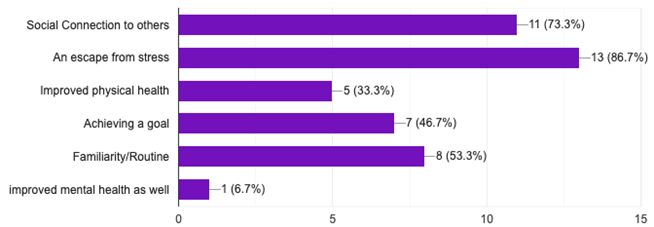
Every participant reported that their hobbies brought them joy. Out of those responses, 86.7% of the students (13 participants) acknowledged their hobbies helped them escape from stress which was the number one contributor to their hobby-related joy. More than 73% (11 participants) mentioned that social connection contributed to their joy. Also, 53.3% (8 participants) answered that familiarity/routine brought joy. One participant filled in the “other” answer to say that their hobby improved their mental health.
Figure 9
Question 16: How would you describe your overall life satisfaction?
(Answered by 15 participants)

The most common response to question 16 had 40% of students (six participants) saying they had a good overall life satisfaction. The second-largest response consisted of a tie between “Great” and “Okay”, both at 26.7% each (four participants). No one said their overall life satisfaction was bad but one mentioned that “It varies on the day” and that they were “Incredibly satisfied with where [they were].” The statistics showed that generally speaking, students viewed their overall life satisfaction as positive.
