Summary of the Data
Summary of the Data
Table 2
Question 1: What is your age range? (34 responses)
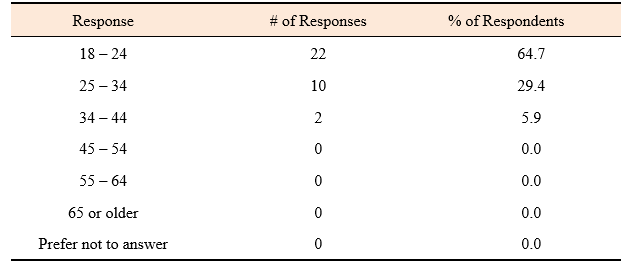
The first question asked participants for their age range. The intent of this question was to identify whether age affects reported stress levels in the Albertan restaurant industry. Out of 34 participants, 22 (64.7%) were aged 18–24, 10 (29.4%) were aged 25–34, and two (5.9%) were aged 35–44.
Question 2: Did You Work for a Restaurant in Alberta, Canada Prior to the Covid-19 Pandemic? (34 Responses)
All 34 participants indicated that they worked in a restaurant in Alberta prior to the Covid-19 pandemic.
Question 3: Have You Worked for a Restaurant in Alberta, Canada Since the Beginning of the Covid-19 Pandemic? (34 Responses)
All 34 participants indicated that they worked in a restaurant in Alberta during the Covid-19 pandemic. Questions two and three were key demographic questions. The central question of this study concerned a change in the mental health of restaurant workers since the pandemic. Therefore, those who did not work before the pandemic or have not worked during the pandemic were not eligible participants for this survey.
Table 3
Question 4: Which of the following best describes your employment situation? (34 responses)
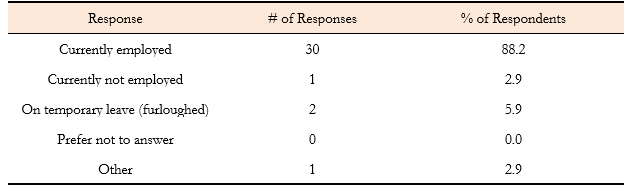
Question four established participants’ employment status. Participants who reported less desirable conditions were expected to experience issues related to income and career development. Question four received one “Other” response, which was specified as follows: “Not getting shifts and quitting soon.”
Table 4
Question 5: In which positions have you worked during the Covid-19 pandemic? Select all that apply. (34 responses)
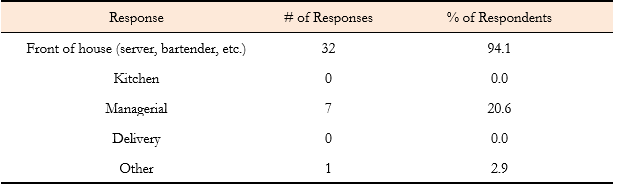
Question five indicated which positions participants have worked in during the pandemic. This allowed the researchers to make assumptions and correlations based on the type of work someone performed within a restaurant. The original intent was for this survey to be generalizable to the Albertan restaurant industry as a whole, but the reality is that it failed to reach kitchen and delivery staff. Without these key demographics, the results of this study can, at best, only be generalized to front-of-house staff in Alberta. Question five received one “Other” response, which was specified as follows: “McDonald’s so the whole thing a staff member does like kitchen front counter (whenever the store was allowed to be open) drive thru and mccafe.”
Table 5
Question 6: PRIOR to the pandemic, how stressful did you find the following work-related challenges? (34 responses)
Question 7: DURING the pandemic, how stressful did you find the following work-related challenges? (34 responses)


Question six measured the stress that workers were facing according to different categories relating to employment before the pandemic. This allowed the researchers to compare pre-pandemic stress levels to pandemic stress levels (question seven). It was found that EmploymentSecurity and Physical Health Risks were typically the least stressful challenges prior to the pandemic, while Workload and Customer Behavior were the most stressful.
Question seven measured the stress that workers were facing according to different categories relating to employment during the pandemic. When comparing the results to those of question six, it became clear that the stresses experienced by restaurant workers during the pandemic were more complex than a simple fear of infection. It was also found that, although they had become more stressful overall, Job Performance, Workload, and Coworker behavior contributed to stress levels less than other challenges during the pandemic.
Figure 1
Question 8: How would you rate your overall job satisfaction? (34 responses)
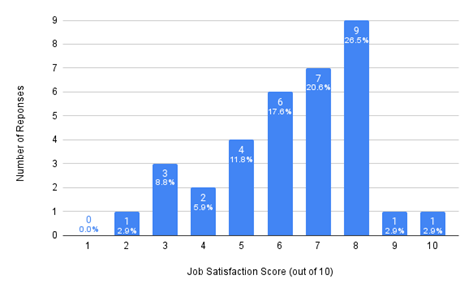
Question eight asked participants to consider their overall job satisfaction—zero is considered ‘very unsatisfied’ and ten is considered ‘very satisfied’. A wide range of responses were given, but most participants reported being somewhat satisfied. The average rating was approximately 6.32 / 10.

Question nine analyzed participants’ mental health and whether it has changed as a result of the Covid-19 pandemic. Mental health is the cornerstone of this research study and understanding how isolation and stress in the service industry impacts participants is crucial. Of 34 participants, 15 (44.1%) felt their mental health had declined somewhat, 12 (35.3%) felt their mental health had declined significantly, two (5.9%) thought their mental health had not changed much, two (5.9%) felt their mental health had improved, two (5.9%) were not sure, and one (2.9%) thought their mental health had improved significantly.
Table 7
Question 10: Do you make use of mental health support products or services (such as medication, therapy, etc.)? (34 responses)
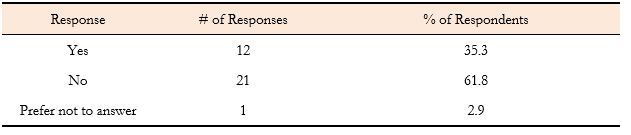
Question ten measured whether participants made use of mental health products or services. This included medication and therapy, which would help workers cope with the stresses they face. Out of 34 participants, 12 (35.3%) made use of mental health support resources, 21 (61.8%) did not make use of mental health support resources, while one (2.9%) preferred not to answer.
Table 8
Question 11: Does your employer provide benefits that cover mental health support (medication, therapy, etc.)? (34 responses)
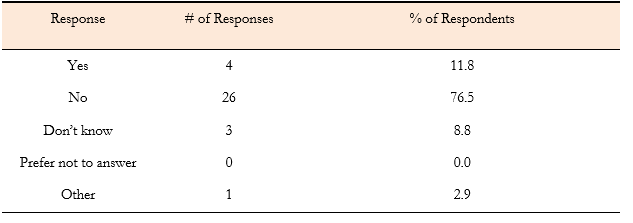
Question 11 asked whether a participant’s employer covered mental health support.Due to the impactful outcome of these resources, it is important that participants knew whetheror not they had access to these benefits through their employers. Out of 34 participants, four(11.8%) responded “Yes,” 26 (76.5%) responded “No,”three (8.8%) responded “Don’t Know,” and one (2.9%)responded “Other.” The “Other” response was specified as follows: “I work part time, therefore Iam not eligible for [benefits].”
Question 12: Please Describe a Few of the Things You Do to Cope with or Manage Work-Related Stress.
Question 12 asked participants to describe a few of the things they do to cope with or manage work-related stress. Because this question was optional and asked participants to give a personal example, it received only 22 responses. Answers in this section included: therapy, meditation, cleaning, yoga, spending time outside, taking a bath, alcohol, shopping, studying, marijuana, and sleep. The most common responses were those that involved socializing, relaxing, or consuming substances like alcohol. For a complete list of responses, refer to Figure B12 in Appendix B.
