Social Media Addiction in Young Adults from the Greater Edmonton Area (Full Article/Chapter 1)
Courtney Bullock, Hanna Leonard, Erica Maybee, Emilie Rubayita
Abstract
The purpose of this study is to explore the relationship between social media usage, social media addiction (SMA), and the effect SMA has on young adults in Edmonton and the surrounding areas. The hypothesis of this study is as follows: Over half of young adults in the Edmonton area are addicted to social media. Six peer-reviewed research studies have been collected that discuss topics such as social media addiction, social media usage, negative effects of social media on young adults, and traits common with high social media usage. The current research will add to the academic conversation surrounding this complex topic. Three phases of data collection were used to collect and analyze the quantitative and qualitative data needed to conclude the research: (1) an online survey on the general conceptions around social media usage, (2) a screen time log that tracked participants’ social media usage hours for one week, and (3) a follow-up interview that determined participants’ perception of social media and addiction. The survey yielded 66 responses, the social media screen-time screenshots yielded 10 participants, and the interviews yielded two participants The main conclusions of this study are as follows: this sample spends more time on social media than the average global population; there is a negative perception and hesitancy surrounding the term addiction; social media has become integral to the lives of most people and is difficult to avoid; and frequent social media use is not always attributed to addiction.
Keywords: social media addiction, young adult, social media, addiction
Introduction
Statement of the Purpose
The hypothesis of this study is as follows: Over half of young adults in the Edmonton area are addicted to social media. This research seeks to discover how many young adults in the Edmonton area struggle with social media addiction. Social media has become an integral part of many lives in the 21st century; it can be consumed in moderate amounts, but young adults may succumb to its addictive design. This research uses surveys, social media screen-time logs, and interviews to evaluate how much time young adults spend on social media. For the purpose of this research, young adults are considered to be people between the ages of 18 and 24 years old. University students are not the only young adults who participated; the participants range from students to full-time workers, people on maternity leave, and parents. Furthermore, for this research, the Edmonton area is considered to be anywhere within city limits or within 20 kilometres of Edmonton—the specific neighbourhoods and cities included are outlined in the survey. Lastly, social media is considered to be one of the following platforms: Facebook, Instagram, Twitter, Snapchat, TikTok, YouTube, and Pinterest.
Research Problem
Most young adults in this generation have grown up with smartphones and social media at their disposal 24/7; therefore, it has become a part of most of their daily lives. This poses the question: Where is the line drawn between frequent use and addiction? The recent addition of the “screen time” feature on most mobile devices has made people aware of how much time they spend on their smartphones daily. This feature illustrates how much time is spent on each app, which is beneficial in determining whether most of their time is spent on social media or elsewhere. With everyone at home for the year 2020, due to the Covid-19 pandemic, screen time reports increased. In 2020, novelist Phil Stamper wrote “when I got that [screen time] notification, I found myself flinching at the results . . .” (as cited in Andrews, 2020, para. 9).
One benefit of studying social media use and addiction is that most of the source material is from within the past decade, due to the recent emergence and popularity of these platforms. Recent research studies are on topics such as the following:
● How social media affects behaviour (Larson, 2021)
● Variables that predict social media addiction (Ciplak, 2020)
● The impact of social media addiction on the well-being of students (Zhao, 2021)
● Social media addiction and the internet (Nakaya, 2015)
The source material on this subject shows that there are harmful effects of high social media use and that it can negatively affect students. Since that has been established, it is first important to determine whether or not young adults in the Edmonton area are addicted to social media before examining its negative effects. Most of these studies also touch on how much time their participants spend on social media; however, there have been no peer-reviewed studies that specifically focus on Canadian young adults, never mind those in the Edmonton region.
Research Question
This study’s research question is: Are the majority of young adults in the Edmonton area addicted to social media? The sub-question is: How does social media addiction impact the lives of young adults in the Edmonton area?
Significance of the Study
Social media addiction is an increasing issue as technology evolves. Technology has become an integral part of people’s lives, whether it be through school, work, or personal use. This research study assesses how much time the average young adult, which includes people between the ages of 18 and 24 years old, spends on social media each day. Most of the research done on this topic has been developed before the Covid-19 pandemic, meaning this current research gives insight as to how increased time at home has affected everyone’s social media usage. Many workplaces and schools have switched to an online format for some of their delivery, increasing each individual’s time spent online. Learning whether or not young adults have increased their social media usage is beneficial for each individual; social scientists can also examine the effects that social media has on the human brain, daily functions, perceptions, and neurological understanding.
Limitations
There are four key limitations within this research study. A substantial limitation is the lack of an agreed upon formal definition of social media addiction. There has been an increased interest in studying the effects of excessive social media usage, but a definite scale of SMA has yet to be established. Currently, social media addiction is not included in the DSM-5, limiting this study to available terminology (American Psychiatric Association, n.d.).
Participation bias that may stem from a negative perception of addiction may also limit the results. The negative perception may be internalized by the participants and addiction denial may skew data. The questioning framework and terminology were staged to reduce data collection and analysis errors.
A limitation within this study is the differentiation between social media use for work, school, and personal reasons. Some of the participants are required to engage with social media more than average, which was reflected in their surveys. Survey question 15 was used to help understand which participants used social media for school, work, or both.
Another area of limitation came from only reviewing the social media usage from a user’s smartphone. The evolution of technology has provided a variety of devices on which to access social media. Having these multiple points of accessibility to social media platforms makes it difficult to track usage across multiple devices. For this reason, the research sample is confined to only cell phone users who can access built-in usage statistics for consistent data collection. The researchers took these limitations into account while conducting the research by adjusting and staging questions and limiting data to specific devices.
Definitions of Terms
Addicted
Exhibiting a compulsive, chronic, physiological or psychological need for a habit-forming substance, behavior, or activity (Merriam-Webster, n.d.)
Dependent Variable
“What happens as a result of the independent variable” (National Library of Medicine, n.d.). For example, in this current study, the presence or lack of addiction is the dependent variable.
DSM-5
Diagnostic and Statistical Manual of Mental Disorders: authoritative volume that defines and classifies mental disorders in order to improve diagnoses, treatment, and research by hundreds of international experts in all aspects of mental health (American Psychiatric Association, 2021).
Independent Variable
“What we expect will influence dependent variables (National Library of Medicine, n.d.). For example, in this current study, social media is the independent variable.
Social Media Addiction
Social media addiction is a behavioral addiction that is defined by being overly concerned about social media, driven by an uncontrollable urge to log on to or use social media, and devoting so much time and effort to social media that it impairs other important life areas. (Addiction Center, n.d.). Although social media addiction is not yet a classified disorder in the DSM-5, “a key aspect of social media addiction is that individuals do not only use social media more frequently, but may experience distress without it” (Lin et al., 2017, as cited in Larson, 2021, p. 233)
Social Media
Forms of electronic communication. . . through which users create online communities to share information, ideas, personal messages, and other content (such as videos) (Merriam-Webster, n.d.)
Young adult
A person who is in his or her late teenage years or early twenties (Cambridge Dictionary, 2022). For the purpose of this research study the age range has been determined as 18 to 24 years old.
Review of the Literature
Introduction
For the purpose of this current study, six peer-reviewed sources were used to guide the research by generating credible sources of information relating to the topic and acknowledging missing factors. The past research studies are used to reference this study’s conclusions with other researchers’ findings and collected data. A change in statistics from past research was presumed due to the Covid-19 global pandemic being identified as one of the causes for an online activity surge, increasing the need and desire to access social media. An abundance of sources exist on the topic of social media usage and addiction, which indicates a growing desire to know more about the effects of increased social media usage on individuals.
Literature Review
Social Media Addiction and Emotional Behaviour
Ciplak (2020) focuses on “[examining] the variables that predict social media addiction” (p. 48); he has two hypotheses related to this:
· H1: “The level of social media addiction related to the weekly time spent on social media” (p. 48).
· H2: “Narcissism, happiness and weekly time spent on social media predict social media addiction at statistically significant levels” (p. 48).
The idea behind this research is that certain traits, notably narcissism and happiness, accompanied by extensive time spent on social media weekly, are good predictors of social media addiction. The official definition of narcissism is considered to be “the self-admiration of the individual” (Freud, 2010, as cited in Ciplak, 2020, p. 49). This research highlights that social media addiction has not been added as an official psychological disorder to the Diagnostic and Statistical Manual of Mental Disorders (DSM-5); however, in recent years, they have included computer gaming as an addiction. Therefore, it seems as though social media addiction is on its way to becoming a classified mental illness (Ciplak, 2020).
The convenient sampling method was used to gather participants for Ciplak’s (2020) study. According to Galloway (2005), “convenience sampling involves using respondents who are “convenient” to the researcher. There is no pattern whatsoever in acquiring these respondents” (p. 860). The study group was comprised of 239 adults (140 women and 99 men) in different regions of Turkey (Ciplak, 2020). The measurement tools included the Social Media Addiction Scale, the Happiness Scale – Short Form, the Narcissistic Admiration and Rivalry Scale, and a personal information form. The three scales all “consist of [varied] items with five-point Likert-type response options” (p. 51). The Social Media Addiction Scale has twenty items, the Happiness Scale has six items, and the Narcissistic Admiration and Rivalry Scale has eighteen items. The methodology in this study is quantitative due to the numerical nature of the scales and the close-ended questions in the personal information form. At the end of the study, both hypotheses were supported by the research. Firstly, those who reported spending more time on social media weekly scored higher on the Social Media Addiction scale. Those who reported spending less time on social media weekly scored lower on the Social Media Addiction scale. Secondly, there was a “positive relationship” between high social media usage/addiction and narcissism (Ciplak, 2020, p. 53). There was a “negative relationship” between high social media usage and happiness (p. 53). This means that the more time participants spent on social media and the higher they scored on the addiction scale, the higher they scored on the narcissism scale. It also concluded that the more time they spent on social media, the lower they scored on the happiness scale.
Ciplak’s (2020) research is significant to the present study for various reasons. Firstly, it highlights that social media addiction is not yet a classified psychological disorder in the DSM-5. Secondly, it highlights the relationship between social media addiction and lower rates of happiness. Mental health is something that many young people struggle with, therefore, if proven that the majority of young adults in the Edmonton area are addicted to social media, Ciplak’s (2020) research shows that this could be one reason for lower rates of happiness among this population.
Theories and Models in Social Media Addiction
Sun and Zhang (2021) explore the models and theories that researchers have attributed to social media addiction over time (p. 1). This review questions what theories and models have been used in existing studies to explain the development of SMA, and what purpose they each serve.
Sun and Zhang (2021) use 55 empirical studies on social media addiction and analyze 25 common theories and models found throughout. The review aids future research by clearly defining the concepts existing studies have used concerning SMA. The review provides a better understanding of SMA, but there is more information to be collected on how these models and theories explain the SMA phenomena (Sun & Zhang, 2021).
Table 1, found in the research article, categorizes the summarized models and theories with their corresponding variables, studies, and sources (Sun & Zhang, 2021). The data from the survey, interviews, and screen time logs of this study were compared to the examples in Sun and Zhang’s review to collect common themes and patterns in the results section.
Though the review itself does not conduct primary research, it examines previous empirical studies and observations. The review categorizes the models and theories based on their relation to the dependent variables found. It is important to mention that some theories and models mentioned are relevant to a variety of perspectives and categorizing them under single structures may be a limitation on the focus construct (Sun & Zhang, 2021). The categories included in the review are: Dispositional difference perspective, Motivational Perspective, Neurobiological Perspective, Decision-Making Perspective, Learning Perspective, Technology Use Focused, Social Network Focused, and Internet Specific Models.
The final sample of the review consists of 55 articles which were screened to include studies that have been peer-reviewed and written in English, focus on the development of SMA and related factors, and apply existing theories and models that enhance future research design. Exclusion from the review’s data search happened when, 1) the study adopted a theoretical framework only to measure SMA, 2) the study did not include any key concepts/constructs from the theories/models they draw upon, and 3) addictive social media use was examined as an independent variable only to predict other concepts (Sun & Zhang, 2021, p. 2). The samples found were used to collect and categorize data, Sun and Zhang (2021) used this collection of research to build the review and table for future researchers to use as a reference guide of common models and theories along with the corresponding variables and studies.
The result of this review is a reference guide for future researchers, including this research team, to use in studies on SMA. Its extensive examination of the theories and models of SMA will aid future research in conceptualizing the phenomenon and its effects on those dealing with these behavioural addiction symptoms. The diversity of perspectives mentioned in the review only begins to explain the complexity of SMA, but a better theoretical understanding of this problematic use is required before intervention (Sun & Zhang, 2021). This current study uses the models and theories provided to support the evidence collected in the surveys, screen time logs, and interviews to conclude interpretive and causal claims of social media addiction and its variables in the psychological condition.
The Social Media Addiction Scale
Tutgun-Unal and Deniz’s (2015) article directly correlates with this current research topic because they developed a scale to measure the addictive traits of social media among university students.
Researchers wanted to determine to what extent social media usage is unhealthy, and where the average university student falls on that scale. The research method used is qualitative as it seeks to understand the reasoning behind human social media obsession. Tutgun-Unal and Deniz (2015) are looking for an answer as to why social media is so intriguing and why it holds the attention of so many users for such a long period.
The Social Media Addiction Scale (SMAS) was developed into a five-point Likert scale. An increase in points from the Likert scale equalled an increase in perceived social media addiction for each individual. Individuals who scored between a certain range of points would be classified anywhere from “No addiction” to “Very High Addicted” (Tutgun-Unal & Deniz, 2015).
In this study, 775 students, holding at least one active social media account, were evaluated according to a five-point Likert scale. The media applications included in the participation standards were Facebook, Instagram, and Twitter so the results were consistent. The ages of university students ranged from 18–45 years old across three universities in Istanbul. Over half of the participants were female, with all participants being distributed across various education departments.
After all initial studies were completed, a framework of 41 items and four factors was developed. Out of all participants, the highest score was 205 and the lowest was 41. It was concluded that 59% of the total variance was viewed as being quite high in social sciences. Researchers expect a social media increase as technology grows and becomes more used in everyday life (Tutgun-Unal & Deniz, 2015).
Tutgun and Deniz’s (2015) research applies to this current study because it compares another way of measuring social media addiction. The Likert scale developed is a reference point for the researchers of this study as data is collected and allows for the comparison of different execution styles.
Smartphone Addiction, Stress, Academic Performance, and Life Satisfaction
Samaha and Hawi (2016) explore the idea that smartphone addiction has negative effects on mental health and overall well-being. One goal of the study was to investigate the link between smartphone addiction risk and life satisfaction, as mediated by stress and academic achievement. The other goal was to assess whether stress and academic performance impact life satisfaction and facilitate smartphone addiction.
The stratified random sample method was used in this transverse study (Samaha & Hawi, 2016). The university’s email system was used to reach out to all students regarding the study and ensure the confidentiality of volunteers. This online survey was completed by 293 students, ranging from 18 to 25 years old, using the university’s student portal. The sample size was reduced to 249 after cases with invalid responses were eliminated from the dataset.
In terms of data collection methods, there were four components to the survey, including one for demographic data and three independent research instruments. Gender, age, education level, and academic major were all listed in the demographic information section. The Smartphone Addiction Scale–Short Version (SAS-SV), the Perceived Stress Scale (PSS), and the Satisfaction with Life Scale were the remaining components (SwLS) (Samaha & Hawi, 2016).
Of 249 students surveyed, 44.6% were at risk of smartphone addiction and 53.4% reported high levels of perceived stress compared to that of students at low risk (49.1%). The average respondent was 21 years old. The results of this study reveal a strong correlation between smartphone addiction and stress, a negative link between smartphone addiction and academic performance, and a mediated negative link between smartphone addiction and life satisfaction (Samaha & Hawi, 2016). This study relates to the current research topic by highlighting the negative effects of excessive use of social media on overall health and well-being, especially concerning youth and young adults.
Impact of Social Media Types and Addiction
Zhao (2021) compares the subjective well-being of social media addicted and non-addicted students through social media use types. Zhao focuses on the influence of different social media use types, and the relationship between social media addiction and subjective well-being. The research answers the question: Does the way a student uses social media affect their subjective well-being?
The study consists of qualitative and quantitative data collection across four categories: social use, entertainment use, social media addiction and subjective well-being.
Figure 1
Social Media Addiction and Subjective Well-Being Research Model
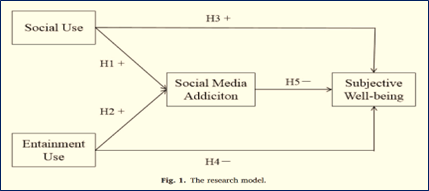
Zhao’s (2021) research model above charts the effects of social use and entertainment use on social media addiction and subjective well-being.
The four measures used in existing sources, regarding similar topics, utilized Likert scale questions. By using Likert scales, researchers were able to assign a numerical value to emotions and behaviours and range them from least to most. The numerical value and range provide the ability to measure a unidimensional variable (Merrigan et al., 2012). The questionnaire Zhao (2021) created was distributed through random sampling at a comprehensive university in Anhui Province, China, with nearly 30,000 students. Four hundred questionnaires were distributed, with 370 valid questionnaires obtained. The total sample included 162 boys (43.9%) and 208 girls (56.1%). The sample was then divided into 224 (60.5%) addicted and 146 (39.5%) non-addicted students. Addicted students were categorized by scoring three or more on at least six responses on the social media addiction scale (Zhao, 2021, p. 3).
The research done by Zhao’s (2021) study supports the interpretative claims that the type of social media use does affect students’ subjective well-being in different ways. The results of the total addicted and non-addicted students show that social use positively predicts the subjective well-being of college students; that is, social use can help them improve subjective well-being (Pang, 2018b). There are various reasons as to why and how social use improves subjective well-being, the reasons seem to focus on the positive enhancements of socialization in real-world behaviours and interactions. Zhao states that this study is “consistent with previous research (Błachnio et al., 2016; Ponnusamy et al., 2020), social media addiction harms college students’ subjective well-being, which is supported in the validation of all three groups” (Zhao, 2021, p. 6). The addictive tendencies caused by the overuse of social media are the reasoning to a decreased overall subjective well-being, producing “symptoms (i.e., salience, tolerance, mood mediation, relapse, withdrawal, and conflict) (Andreassen et al., 2012) which will have adverse effects on their mental health, learning and life, and then reduce their subjective well-being” (Zhao, 2021, p. 5).
Zhao’s (2021) comparative analysis and sources were used in the creation of the survey, interview questioning, and framework. Similar Likert scales were used as the four variable measurements mentioned by Zhao: social use, entertainment use, social media addiction and subjective well-being. These measurements provided participants with a variety of response options that were still controlled for consistent data collection and analysis. The data collected from this research study was compared to Zhao’s data and hypotheses conclusions. Numerical data were analyzed according to the sample Zhao provided to verify the validity of the current hypothesis on the prevalence social media addiction and the impact SMA has on the lives of young adults.
Social Media Usage and Fear of Missing Out
Gosain and Yadav (2020) investigate the impact of social media usage (SMU) and the fear of missing out (FOMO) among youth. To achieve this, Gosain and Yadav assessed the difference between adolescents and young adults in relation to SMU and FOMO, the effects of social media usage among adolescents, the effects of social media usage among young adults, the effect of FOMO among adolescents, as well as the effect of FOMO among young adults. There are two hypotheses for their study:
· H1: There will be a significant level of difference between youngsters on FOMO (p. 78).
· H2: There will be a significant level of difference between youngsters on usage of social media (p. 78).
In some research experiments, there is a dependent variable, which gets tested and measured in an empirical study or scientific experiment; there is also an independent variable, which is controlled in a scientific experiment to test the effects on the dependent variable (Gosain & Yadav, 2020). In this particular study, three variables were being measured, two of them being dependent: FOMO and social media usage. The independent variable is the age of adolescents (13–17 years) and young adults (18–25 years). To study independent variables such as age group, social media usage, and fear of missing out, a total sample of 100 students from different age groups was taken, resulting in 50 school-aged students (13 to 17 years old) and 50 college-aged students (18 to 25 years old). All the participants were selected using the “FOMO tool” (Przybylski et.al., 2013). Both male and female participants were selected through a purposive sampling technique, and they were asked to identify their social media usage using two open-ended questions: i) Everyday time spent on social media networking websites (in hours) and ii) Day by day recurrence of visiting internet-based profiles.
Gosain and Yadav’s (2020) study utilizes quantitative research methods and was conducted at both high school school and university level. Other questions asked of the participants include: “are you on more than two social networking sites?” which they confirmed; “Usually you use social media for professional, educational or business purposes?” which more than 90% of the participants denied; and “which one is more satisfying either playing games online like PubG or preferring to play outdoor games?” more than 85% of the participants from both age groups answered that they spent hours playing games online, to which they prefer over any other outdoor game (p. 80). To organize and interpret the data obtained, statistical techniques such as mean, SDs, and t-tests were utilized. A survey was also carried out to find out the degree of FOMO and social media addiction faced by youth, using a questionnaire and interview plan to collect data for the study. It contained 10 close-ended questions related to FOMO and two questions related to social media usage, a few general questions related to both the variables were also asked for the interview schedule.
In concluding the study, it was found that everyday time spent on social media networking websites was substantially different for adolescents from that of young adults (Gosain & Yadav, 2020, p. 82). Thirty-two percent of adolescents spent 1–3 hours on social media daily, 34% of them spent 4–6 hours, and 34% of them spent 7 hours and more. Thirty-two percent of young adult participants also spent 1–3 hours on social media daily, 60% spent 4–6 hours, and only 8% of them responded that they spent more than seven hours. In response to the question of “day-by-day recurrence of visiting internet based profiles”, adolescents responded that 26% of them visit social media profiles 3–5 times daily, 16% visited them 6–10 times and 58% of them visit social media profiles 11–20 times daily. Young adults’ percentages differed from that of adolescents in terms of frequency of visiting social media platforms, as 36% of them responded that they visit their social media sites 3–5 times daily, 36% about 6–10 times a day, and only 28% responded that they visit social media profiles 11–20 times daily (Gosain & Yadav, 2020, p. 83). This indicated that adolescents are more dependent or addicted to social media usage.
Gosain and Yadav’s research is relevant to the current research study, as it seeks to understand the rise of youth’s engagement in social media, using a concept called fear of missing out (FOMO). FOMO is an example of a social psychological process which has been associated with excessive usage of social media platforms. The current study uses a comparative analysis to highlight the understanding of social media usage and FOMO among adolescents and young adults, and thus proves that there is a significant difference between youth social media usage and FOMO.
Contribution This Study Will Make to the Literature
There is a significant amount of literature surrounding the negative effects of high social media use and social media addiction. Many of these studies also address social media addiction and highlight that “a key aspect of social media addiction is that individuals do not only use social media more frequently, but may experience distress without it” (Lin et al., 2017, as cited in Larson, 2021, p. 233). Although the studies above prove a relationship between high social media usage and social media addiction, high usage alone is not enough to constitute addiction. It is important to perform continual research regarding this topic because technology and social media platforms are constantly evolving. For example, TikTok did not exist until 2016 but is now one of the most popular social media platforms amongst young people (D’Souza, 2021). Furthermore, no specific research has been done on young Canadian adults and social media use and addiction, especially anything specific to Alberta or the Edmonton Area.
This is where the current research study adds to the discussion. It is also important to acknowledge that the Covid-19 pandemic may play a significant role in increased social media use among young adults. Social media addiction statistics may have changed substantially in the past couple of years. This specific sample and period in time are what makes this study different from others that are similar. This research will also represent Alberta on a global scale when it comes to research surrounding social media addiction in young adults.
Review of the Problem
This current study is focused on investigating whether or not the majority of young adults, ranging from ages 18 to 24, in Edmonton are addicted to social media. The impact social media has on the lives of young adults was closely examined by exploring how social media affects behaviour (Larson, 2021), variables that predict social media addiction (Ciplak, 2020), as well as the impact of social media addiction on the health and well-being of students (Zhao, 2020). Insight can be gained from the sources included in the literature review, as they provided data that support the study’s hypothesis and research questions.
The research team learned that social media addiction is not yet a classified psychological disorder in the DSM-5 and that there is a close relationship between social media use and addiction and social behaviours like social skill deficits. There is also a strong correlation between smartphone addiction and stress, a negative link between smartphone addiction and academic performance, and a mediated negative link between smartphone addiction and life satisfaction (Samaha & Hawi, 2016). Additionally, social media addiction can be a cause of lower rates of happiness in youths, FOMO (fear of missing out) being a significant example of a social psychological process which has been associated with excessive usage of social media platforms (Gosain & Yadav, 2020). These insights complement the current study’s findings and contribute to a further understanding of social media’s impact on the lives of young adults, particularly in the Edmonton region. These topics will be expanded upon in the conclusions.
Methodology
The research team used a mixed-methods research approach to test their hypothesis, which is as follows: Over half of young adults in the Edmonton area are addicted to social media. The researchers started by collecting and analyzing quantitative data, then collected and analyzed qualitative data in a second phase as a follow-up to the quantitative results. This design connected the three phases by using the quantitative results to shape the qualitative research questions, sampling, and data collection. Quantitative methods aided in quantifying patterns in attitudes, behaviours, and other defined variables, to contextualize the results from the study sample in a wider population of the same age group. Qualitative methods were used to analyze non-numerical data and understand concepts related to the research topic. The research team utilized three phases to collect research data. Phase one involved a survey distributed online, phase two involved a collection of screen time logs, and phase three involved participant interviews. These were used to evaluate the addictive tendencies to social media held by each participant.
Phase I: Survey
The online anonymous survey, conducted on Google Forms, contained closed-ended questions to collect data from a predefined group of participants and used random selection as a data collection method. Simple random sampling ensured inclusion in the survey, as each participant in the target demographic had an equal chance of being selected. The age range of the participants was limited to young adults between the ages of 18 and 24 years old, specifically residing within Edmonton city limits and 20km outside limits. All participants were informed fully and truthfully and guaranteed confidentiality before consenting to participation. The researchers also refrained from using the word ‘addiction’ until the interview phase, to avoid influencing or skewing participants’ responses. Instead, the term was rephrased and substituted with words such as ‘significant/substantial use, habits, dependence’ to ensure accuracy while avoiding any negative connotation associated with the word ‘addiction’. The survey was shared on each of the researchers’ personal social media accounts (Instagram, Facebook, and Twitter) as well as in several private social media groups. Personal platforms used and their approximate reach:

In addition to these personal platforms, the survey link was also posted onto three private pages on Facebook and one private messaging channel via Slack:
● MacEwan University Student Experience (7.6k members)
● 2020/2021 MacEwan University First-Year Students (2.4k members)
● MacEwan Sh*tposting (2k members)
● MacEwan Public Relations 20202/21 Slack Channel (48 members)
The survey consisted of 15 questions with one additional question inviting participants to participate in further research. The questions covered demographics, social media usage and habits, and social media attitudes. The survey was distributed on October 26, 2021, and stayed open for 10 days until November 5, 2021, at midnight; it collected 66 valid responses—some were deleted due to age requirements.
Phase II: Screen Time Log
Participants who indicated interest and consent to continued study involvement were then contacted by the researchers. At this point, the participants’ survey number was used as a reference to maintain anonymity. The screen time logs are a collection of behavioural observation data, tracking how much time each participant spends on social media daily.
The screen time log was tracked across a one-week duration in the beginning of November 2021. Some participants had sent days that were not described by the example for the search but were still included in the data collection, recorded under the days they had provided. The screen time data was used to confirm social media screen time usage over the specified period of time. Social media usage data is collected and provided by most cellular phones (e.g., Apple and Android); this feature (if available) was used to date the back data to the week prior. By tracking the data before the meeting, possible limitations that may be caused due to participant bias were reduced. Farnsworth (2019) explains that “participants will sometimes second-guess what the researcher is after, or change their answers or behaviors in different ways, depending on the experiment or environment. This is called participant bias, or response bias, and it can have a huge impact on research findings” (para. 2).
The sample for the screen time log includes the young adults, aged 18–24, that had previously completed the initial survey and consented to disclose their social media usage data. This sample is not exclusive to university students, but through the availability of the personal outreach of the research team, it was assumed many of the participants would be students. The sample was localized to the Edmonton region. The sample participants were required to have the screen time tracking feature downloaded to their cellular phones, computer and/or other devices they use daily to qualify for continued participation.
Participants were required to have mobile devices with screen time tracking to represent the sample of social media users. Through “always on” technologies, the availability of communication is now the norm for many people for most of the day (Ling, 2012). Abstaining from media use and communication access is an action that now requires intentions, planning, and specific arrangements (Klimmt et al., 2018). The current climate of society calls for the use of mobile devices and social media in young adults’ daily routines, therefore providing the opportunity to track how much of the modern daily device usage is spent on social media.
Data collected was used to generate the average social media usage hours across the sample, as well as noting the maximum and minimal times. The data was then compared to the peer-reviewed research on addictions and social media usage to see how the data correlates to previous research and definitions. The data collected was measured at a ratio level, providing the ability to record precise hours of usage across all participants. The precise hours were then analyzed by external factors such as the participants’ general schedule, daily social availability, and the significance of the weekday to usage. Qualitative data measured these external factors that control daily time and accessibility participants have to their devices for social media usage. The amount of time each participant has in their schedule available to use social media impacts the results. For example, if a participant is working or in classes that day, they may not have time to be on social media, compared to a day off where they have more time to spend online than usual. It is important to note that participants may have to use social media for their jobs. This factor may cause limitations and skew data; this was reduced by asking participants about the correlation between social media and work during this time.
In summary, the screen time log consists of data collection already provided by the participant’s cellular phone devices. This methodology requires education on how to access the desired data, and confirmation of the collected data’s validity. An example of a screen time data log was created to show what information was key in gaining a general sense of social media timing through quantitative data. The screen time log results were analyzed with the variables previously mentioned to generate an accurate representation of causal claims.
Phase III: Interviews
The third data collection approach used, the interview, was composed to answer any open-ended questions generating qualitative data that might have been lost in translation through a survey response. The survey and interview questions were staged to not allude to any preconceived bias towards addictions, possibly skewing the data collection. Two interviews were scheduled, each with two research team members. The interviews were conducted and recorded via a secure online room, and the recordings were then uploaded to a secure Google Drive in their respective folders. Transcriptions of the interviews were written and filed accordingly. The sample population for the interviews were those who expressed interest and consented to be contacted in the initial survey and met all other participant criteria.
The two interviews conducted were approximately 15 minutes in length. Data was collected by the secondary interviewer in a blank questionnaire. The answers were then analyzed by the research team for themes: beliefs, values, and practices in the behavioural observations marked by the survey and screen time log. The responses provide the qualitative data required on participants’ perception of social media and addiction.
The interviews provided further information towards explanatory claims through self-reporting of the participants. Self-reporting is important in this phase of the research, as it provides an insight into how the participants view their own prior, current, and future beliefs on their behaviours and characteristics surrounding social media addiction. Systematic sources of error are possible, as biases may become prevalent throughout this method. Farnsworth (2019) explains how participation bias can be reduced “by ensuring the participants that their data is truly confidential,” and by creating a judgment-free zone when conducting the research (para. 11). Staging the questioning framework may reduce confirmation and normalcy biases caused by possible shame and/or denial found through the verbal interview following the participants’ disclosure of their behavioural habits.
Results
Introduction
A mixed-methods approach (three phases) was used for this study: surveys, social media screen-time screenshots, and interviews. The survey yielded 66 responses, the social media screen-time screenshots yielded 10 participants, and the interviews yielded two participants. Below, there is a section for each data collection method. Some survey questions have an associated graph or table (see Figures 2–5 and Tables 2–3) and the social media screen-time data is laid out in tables (see Tables 4–5).
Survey Results
Question One: What is your Age Range? (N=72)
Question number one determined the age ranges of the survey participants. Six participants over the age of 25 did not meet the requirements for the target demographic (18–24 years) and their survey results were removed from the data collection. The participants who were removed indicated their ages as the following: 25, 25, 25, 28, 30, and 27. The ages of eligible participants varied slightly; the most frequent age bracket was 26 participants (39.4%) aged 23–24, 23 participants aged 21–22 (34.8%), and the least frequent age bracket was 17 participants aged 18–20 (25.8%). The results of this question were crucial in determining the age demographics laid out in the research question; “young adults” was previously defined as those 18–24 years of age. Question one also shows what audiences by age the survey reached and what age groups showed the most interest in participating in this research topic. The response with the most participants was the 23–24 age group with 26 participants (39.4%) showing the most interest in participating in the research topic.
Question Two: What are your Preferred Pronouns? (N=66)
The results of the survey’s second question were not necessary for the research study and data analysis. These results were used to appropriately address participants that consented to participate in phase two of the research study. Out of 66 survey respondents, 55 answered question two. Forty-five of those responses identified their preferred pronouns as “She/Her”, and 20 of the responses identified with “He/Him.” As such, there was a higher representation of female-identifying participants (69.2%) than male-identifying participants (30.8%). Two alternate options were available for participants to choose from: “They/Them” and “Prefer not to answer”. No participants selected these responses (0%). The one participant that did not answer question two may not have felt comfortable choosing either option available.
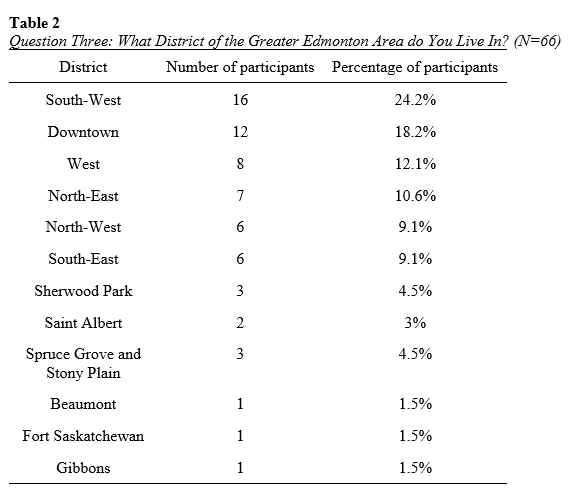
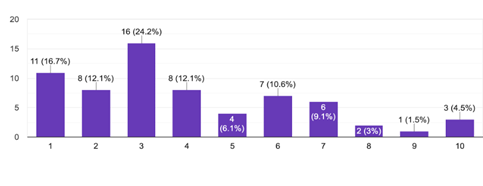
Question three of the survey was used to show where the participants reside in Edmonton. The geographic results of this question determined the eligibility of respondents according to the target demographic defined by the research question: “Edmonton area.” The results show that out of 66 participants, the majority of 16 participants reside in the South-West district of Edmonton (24.2%) and the second-largest representation closely followed with 12 participants from the Downtown district (18.2%). Four of the districts average closely in the middle: eight from the West (12.1%), seven from the North-East (10.6%), six from the North-West (9.1%), and six from the South-East (9.1%). Three districts with equal-lower representation: three from Sherwood Park (4.5%), two from Saint Albert (3%), as well as two from Spruce Grove (3%). Four districts had only one respondent: Beaumont (1.5%), Stony Plain (1.5%), Fort Saskatchewan (1.5%), and Gibbons (1.5%).
Figure 2
Question Four: Please Select All That Apply Regarding Your Employment Status. (N=66)
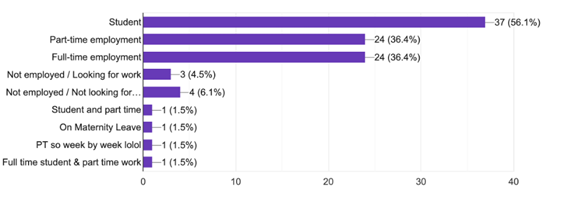
For question four, there were five initial response options, as well as the opportunity to add an option that the participants deemed more applicable. This was used by some participants to group their responses instead of selecting all that applied. In the following analysis those responses were added to the corresponding answers. Thirty-nine out of 66 participants responded with the employment status “Student” (59.1%); This includes 37 participants who selected “Student”, as well as one student who wrote “Student and part time” and one who wrote “Full time student and part time work”. The number of participants that responded with an employed status reported that 26 overall work part-time (39.4%)—again, this includes the two participants who wrote “Student and part time” and “Full time student and part time work”—and 24 work full-time (36.4%). Three participants responded that they were not employed and looking for work (4.5%), and four reported that they were also not employed but were not looking for work (6.1%). One participant responded with their status as “On Maternity Leave” (1.5%). The responses to this question give the background on the participants’ average daily schedules and their availability to access social media.
Question Five: Do You Have a Social Media Account(s)? (N=66)
All 66 participants indicated that they have one or more social media accounts.
Question Six: On Average, How Often Do You Visit Social Media? (N=66)
Of the 66 responses, 40.9% (27) of the participants use social media every hour, 33.3% (22) use it every 30 minutes or more, and 25.8% (17) use it every couple of hours. None of the respondents indicated that they use social media “once a day” or “once a week or less” as the options presented. This confirms that the majority of young adults in the Edmonton region are active on social media platforms daily, which contributes to some of the excessive habitual behaviours seen throughout the study.

Table 3 shows that 62.1% (41) of all participants use social media in their free time, 28.8% (19) use it when they’re supposed to be doing other things, and 7.5% (5) indicated both. The remaining 1.5% (1) was from a respondent indicating they use social media most in between studying. The researchers can infer from these percentages that while most young adults use social media excessively, this occurs mainly during leisure time for the majority.
Figure 3
Question Eight: What Do You Use Social Media for the Most Often? Select All That Apply. (N=66)

In question eight, participants were asked to select all that apply when it comes to what they used social media for most often. The most selected option was 54 (81.8%) participants, indicating that they mostly use social media to pass time or overcome boredom. The least popular option was the use of social media to ‘share personal moments with my network/public’ only selected by 24 (36.4%) of respondents. A good option for this question would have been “For school and/or work purposes” because question 15 indicated that a large number of respondents (60.6%) also use social media for both work and school or one or the other.
Figure 4
Question Nine: On a Scale of Very Often to Never, How Often Do You Find Yourself Using Social Media Longer Than Intended? (N=66)

Figure 4 asks participants how often they find themselves using social media longer than intended—one being very often and five being never. The highest-ranking answer was “very often,” with a total of 18 participants (27%), choosing this. Although, the rest of the participants were evenly distributed in the other choices. Averaging about 21–22% for options two (14 responses), three (15 responses), and four (14 responses). Forty-seven (71.2%) participants frequently use social media more often than intended—this number encompasses the first three response options on the scale. The variety in these answers shows that a clearer question should have been asked. What each number meant, or even a simple three options (very often, sometimes, and never) could have been added. This may have allowed the receipt of more decisive answers to provide a clear conclusion to this question.
Question Ten: Has Social Media Become Significant to your Daily Routine? (N=66)
Eighty percent (80%) of users answered yes to social media becoming a part of their daily routine. This supports the observation that young adults have become reliant or habitual in using their social media each day, whether it be to send messages, check on updates of friends or the world, or even just to take up time in the slow parts of their day.
Question Eleven: What Device Do You Use Most Often to Access/Use Social Media? (N=66)
Almost all participants (65 out of the 66 responses) said they used cell phones to access social media throughout their day. This shows us that having growing technology and the ability to access social media with the click of a button creates an easy access environment for users to become habitual with checking their phones, messages, media, status updates, etc.
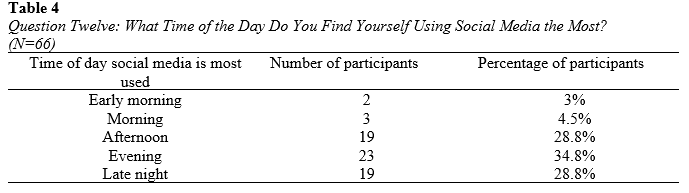
Participants were close to being evenly distributed between using social media mostly in the afternoon (28.8%), evening (34.8%), and late-night (28.8%). This suggests that as people finish what they need to get done for the day, they have excess time to spend on social media.
Question 13: How Do You Feel Your Social Media Use Has Changed Since the Covid-19 Pandemic? (N=66)
Over half of the 66 survey participants indicated that they use social media more often than before the pandemic—56.1% (37/66). Very few indicated that they use it less often than before—3% (2/66)—and less than half—40.9% (27/66)—indicated that they use it the same amount as before. This is important because it shows that the data concerning social media addiction that is presented may differ from prior years due to the onset of the Covid-19 pandemic in 2020.
Figure 5
Question 14: How Do You Feel Your Social Media Use Has Changed Since the Covid-19 Pandemic? (N=66)
For question 14, participants were asked to rank how they feel when they do not have access to social media. The beginning of the rank (1) is no discomfort, and the end of the rank (10) is strong discomfort. The majority of respondents indicated that they had either no discomfort or varying levels of low discomfort when they do not have access to social media. To be precise, 65.1% (43/66) of respondents ranked themselves below the halfway point (no to little discomfort), 28.7% (19/66) ranked themselves above the halfway point (strong discomfort), and 6.1% (4/66) ranked themselves in the middle (medium discomfort) (see Figure 5). Forty-seven (71.2%) participants feel little to no discomfort when they cannot use social media—this number encompasses the first five response options on the scale.
Question 15: Do You Use Social Media For Work/School Purposes? (N=66)
Question 15 asked participants what they typically use social media for. Out of 66 respondents, 39.4% (26/66) indicated that they do not use social media for work or school purposes, 30.3% (20/66) indicated that they use social media for work and school needs, 18.2% (12/66) use it only for work needs, and 12.1% (8/66) use it for school needs. In total, 60.6% (40/66) of participants use social media for either both work and school or one or the other. This is significant because it shows that not all social media use is up to the participant, some of it is necessary for other life responsibilities and cannot all be attributed to personal entertainment or communication purposes.
Social Media Screen Time Log Results

Interview Results
Participant #51
Participant 51 was the first to be interviewed; he completed the survey before being interviewed but did not consent to provide his social media screen time. Some general themes and attitudes that were common in this interview are the following: social media generally has a negative impact on his life; fear of missing out (FOMO) is what ties him to social media; he believes he has qualities of social media addiction.
This participant stated that social media has been more prevalent in his life since the beginning of the Covid-19 pandemic. This is partly because he uses it for communication and social purposes and partly because he uses it more during online classes than during in-person classes.
This participant also highlighted that fear of missing out is a big reason he feels tied to social media. When presented with a hypothetical scenario about all social media being inaccessible for the day, he expressed that it would have an extremely positive effect on his life. If nobody else has access to social media, he does not feel like he would be missing out on anything and would be less inclined to miss it.
When presented with a definition and explanation of social media addiction, he expressed that he feels as though addiction is a spectrum and that he has certain qualities of social media addiction and may fall somewhere along the spectrum. A comparison between his survey answers and his interview answers to determine the likelihood of social media addiction can be found below in the Comparisons section.
Participant #58
Participant #58 was the second interviewee. She completed the survey and consented to participate further in the study by providing daily screen time logs and doing a follow-up interview. Being a student and part-time employee, this participant indicated that she uses social media for both work and school purposes. She is most active on social media during weekdays more than weekends, as it is easier to turn to her social accounts as a way to procrastinate during her classes, as opposed to in a work environment. Although she finds herself using social media the most when she’s supposed to be doing other things, her survey results reveal that she is not dependent on social media and tries not to base her day around it.
When presented with a hypothetical scenario about all social media being inaccessible for a day, she explained that while she might initially be affected, it would not be the end of the world. She values more functional sites such as Gmail or Blackboard and would be more affected if they were down for a certain period of time. Contrary to the first interviewee’s FOMO as a cause of social media attachment, this participant expressed that she does not feel a need to keep up with what is trending, and instead prefers to use apps such as TikTok, that require minimal amounts of direct social interaction.
As a result, she believes that social media generally has a positive impact on her mental health and overall quality of life. She defines social media addiction as “feelings of physical and emotional discomfort anytime you are not around your phone”. With this definition in mind, she states that she would not consider herself addicted to social media, but rather a frequent, but responsible, user of certain social media platforms for mainly entertainment purposes.
Discussion, Conclusions, Recommendations
Introduction
With a total of 66 survey responses, 10 social media screen-time log participants, and two interview participants, this study was able to collect significant data regarding the social media use and habits of young adults in the Edmonton area. This study differs from others in the way that it strictly focuses on this niche sample, as opposed to a broader population. Outlined below is a discussion related to the hypothesis of this research as well as four main conclusions and four significant comparisons. The section concludes with three recommendations for future research surrounding this topic.
Discussion—In Relation to Hypothesis
The hypothesis of this study was as follows: Over half of young adults in the Edmonton area are addicted to social media. As previously stated, the DSM-5 does not yet include social media addiction as a classified psychological disorder; however, computer gaming is listed as a disorder, so it seems as though social media addiction is on its way to becoming an official disorder (Ciplak, 2020). The closest definition of social media addiction that was found in other research is: “a key aspect of social media addiction is that individuals do not only use social media more frequently but may experience distress without it” (Lin et al., 2017, as cited in Larson, 2021, p. 233). Because social media addiction is not an official classified psychological disorder, there are no criteria for qualified physicians to use for diagnosis. Since the researchers of this study are not licensed mental health professionals, they do not have the authority to determine whether or not the participants of this study are addicted to social media. Although this is the case, several conclusions were made throughout the research that contribute to the academic discussion surrounding this topic and provide some insights that may benefit further research.
Conclusions
Conclusion 1: Average Time Spent
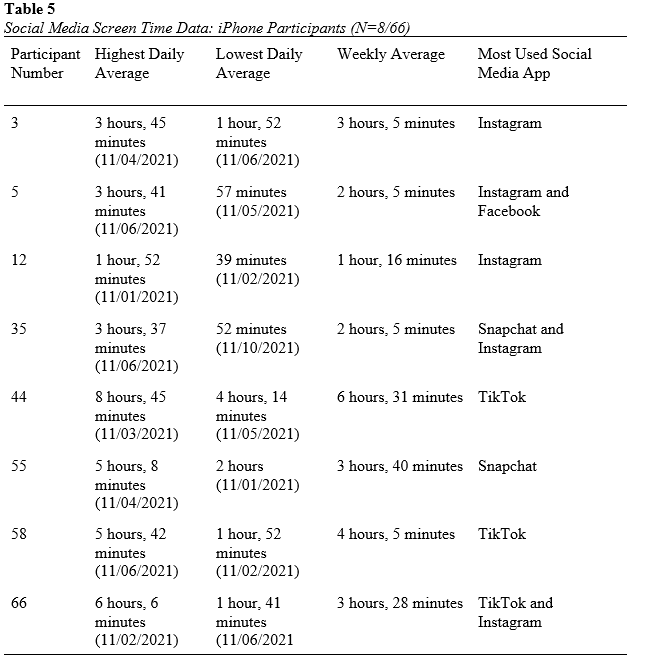
While looking at all the social media screen time data as a collective, the average time spent (sum of all weekly averages/number of participants) on social media daily was three hours and 16 minutes. This does not include participants #2 and #36; these participants have Android smartphones that do not provide the data for time spent specifically on social media, only overall screen time. Below is the breakdown of which social media apps were most common among individual participants:
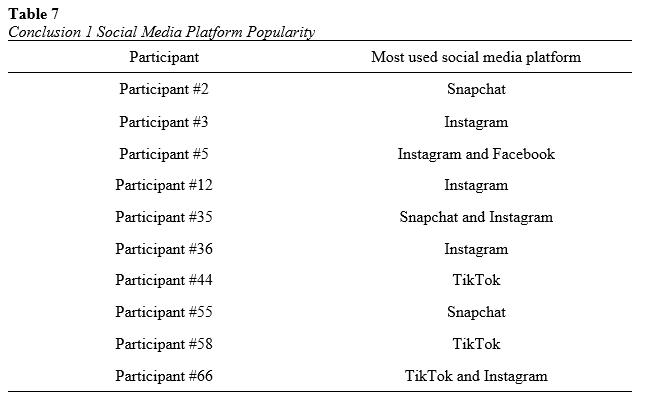
As seen above, Snapchat, Instagram, and TikTok are the most used social media apps among Edmonton young adults who sent in their social media screen time screenshots. By a narrow margin, Instagram is the single most popular social media app. Further research could be done to determine why this is the case and what separates Instagram from other social media platforms. Based on the results, the average time spent on social media was three hours and 16 minutes and most of it was spent on Instagram. According to a worldwide study, the average daily time spent on social media across the globe is two hours and 41 minutes for people between the ages of 16 and 64 (Statista, 2021). Statista (2021) also showed that the most used social media platform in the world is Facebook; Instagram only ranks at #4 for worldwide popularity, after YouTube and WhatsApp. This current study’s results indicate that young adults’ social media habits differ from worldwide averages. Young adults in Edmonton have a higher daily average spent on social media in comparison to the general worldwide population. The results also indicate that they do not use the most popular worldwide social media platform most frequently; instead, they frequent Instagram the most.
Conclusion 2: Participant Perceptions
The perception of social media addiction plays a key role in defining a young adult’s behaviours. Screen time data is used to track all aspects of cell phone usage, but few users examine their daily social media use as its own aspect and only view the total screen time hours. This may be due to the preconceived notion that cell phone and social media users are constantly on their phones. With the ease of accessing any app in milliseconds while using their phone, users do not always realize the behaviours that follow. When analyzing questions #9, #10, and #14 together, there seems to be some disagreement between the claims of excessive social media usage and the participants actual feelings towards their use of social media. An equal number of responses (71.2%) stated they did not feel uncomfortable when not using social media (see Figure 5), yet the same number of participants (71.2%) claimed they use social media “often” to “more often than intended” (see Figure 4). A high number of participants also stated that social media use has become a part of their daily routine. There must be some deliberation amongst these factors when it comes to social media addiction. In the interviews, both participants stated that they see the addictive tendencies that may result from excessive social media usage. Although, they did not openly state that they believe they are addicted to social media. This information together shows that young adults may exhibit addictive tendencies to social media but there is a negative perception of the word “addiction”. The difference is shown between one’s personal definition of addiction and their actual behaviours. Throughout this current study, the researchers worked diligently to not use the term addiction until the end of the interview to avoid confirmation bias. Although, it may be concluded that young adults are aware of social media addiction and their behaviours, but do not want to define themselves as addicted due to the negative connotation attached to the concept. The negative perception of “addiction” may skew the results when researching social media addiction, and this is shown through the inconsistency in results regarding individual perceptions, claims, and behaviours.
Conclusion 3: Adaptation to Social Media
The research suggests that young adults are addicted to social media. However, when taking into consideration the progression of technology, its accessibility, and the need to have it to function properly in society, young adults may not be as addicted to social media as initially thought. Young adults used to do school or work without technology, now it is a requirement in most scenarios. Young adults used to get news from papers or coffee shops, whereas now everything is delivered online. Young adults are seen as being addicted to social media but in reality, they are adapting to the current societal standard. This may not be the “right” thing; it could be argued that social media is too accessible or too prevalent in society, but that is not the focus of this research. Whether using social media this much is right or wrong, young adults seem to be using it as it was meant to be and as they are required to in work, school, or in their daily lives.
Conclusion 4: Social Media Use and Other Factors
As shown in the study, many young adults engage in some form of online media daily. Before concluding that the majority have an addiction to social media, it is important to first consider some of the factors that contribute to this excessive use. Social media addiction is often characterized by a combination of excessive media consumption, high reliance on social media, and an inability to control this behaviour despite suffering decreased physical and social engagement. With the Covid-19 global pandemic especially, social media has been a largely used tool for allowing people to stay in touch despite being miles apart, communicating at instantaneous speeds. Social media has also been a tool for some to engage with school and work communities, as reflected by 30.3% of the survey respondents (question 15). While 80% of participants admitted that social media has become significant to their daily routine (question 10), when asked how they would feel if they had no access to social media for a day, the majority indicated they would have little to no discomfort. This shows that the term “addiction” is often used too loosely, and it is vital to distinguish between addicted habits and usage.
After analyzing the results of this study, the prevalence of social media addiction symptoms was substantial among Edmonton’s sample of young adults. With the characteristics of social media addiction stated above in mind, it would be inaccurate to deem all young adults addicted, as the majority of the survey respondents indicated that they had either no discomfort or varying levels of low discomfort when they do not have access to social media (see Figure 5). Similar to the second interview subject, many young adults frequently use social media as a means of keeping up with what is going on in their personal network, as well as for entertainment purposes, but are not necessarily addicted to social media, despite displaying some addictive tendencies. It would be unrealistic to assume that all young adults have an addiction to social media, simply because the vast majority use some type of online social networking platform and spend a lot of their time online.
Comparisons Within This Study
Comparison 1: Survey and Interview Data—Participant #51
The first interview responses, from Participant #51, were compared with their survey responses to determine the likelihood of social media addiction. Below, some relevant survey questions along with Participant #51’s answers have been selected:

In participant #51’s interview, he was asked whether or not he would consider himself addicted to social media. Before being asked this question, the interviewers discussed his social media habits and attitudes and defined social media addiction with the following definition: Although social media addiction is not yet a classified disorder in the DSM-5, “a key aspect of social media addiction is that individuals do not only use social media more frequently, but may experience distress without it” (Lin et al., 2017, as cited in Larson, 2021, p. 233).
Participant #51 stated that he would place himself on the spectrum of social media addiction and that he does have qualities of social media addiction. This is interesting because while looking back at his survey answers, he indicated that he rarely finds himself using social media more than anticipated and that he only feels mild discomfort in the absence of social media. It appears that once he was presented with the concept of social media addiction, he reflected on his habits. Mostly, his survey responses do coincide with his statement of placing himself low on the “spectrum” of social media addiction.
Comparison 2: Survey Question #12 and Screen-Time Logs
The second comparison examined the results of survey question #12, “What time of day do you find yourself using social media most?” to the data collected by the screen time logs. In the survey, question 12 responses show that most participants believe they use social media often in the evening (34.8%). The second and third highest responses came in equally, claiming they use social media most during the afternoon (28.8%) and late-night (28.8%).
Through the screen time log data collected regarding the time of day, results varied depending on the participant. The time of day spent on social media by most participants according to their screen time logs was around 6:00 p.m. to 11:00 p.m., defined by the survey response as “Evening.” Other times of day that were often used include the afternoon, which compares accurately with the equally second highest survey response. Some late-night averages were shown in the data, but not as much as an unexpected result, morning social media usage. The data collected from participants 12, 35, and 58, all show the results of frequent social media use in the hours between 6:00 a.m. to 12:00 p.m. Participant #12 was only one of the three survey respondents that stated they use social media most in the morning. The other two participants (35 and 58) that frequently used social media in the morning both stated they believed they used it most in the evening. In the survey, three respondents stated they often used social media in the morning, but two of those three did not participate in the screen time data log.
This data analysis from the screen time logs supports the accuracy of the survey responses claiming that social media is used most frequently in the evening. The evening tends to give young adults time to relax and unwind, which may explain the free time in their schedules that they may be able to use social media. Future research may investigate and explain the use of social media in the morning; survey self-reports claim that the morning is when social media is least used, although this is occasionally contradicted by participant screen time data.
Comparison 3: Survey, Screen Time Logs, Interview—Participant #58
For this comparison, Participant #58’s answers to the questions below were compared to what her screen time logs and interview revealed. This participant was the only one who completed all three data collection methods: the survey, the screen time logs, and the interview.
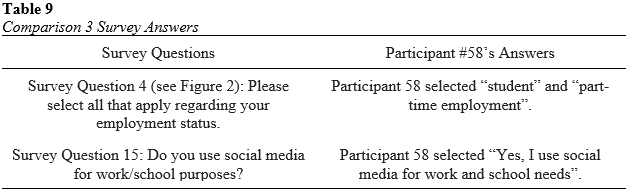
Upon looking at the screen logs submitted, this individual seemed to spend the most time on TikTok. It was unclear whether this was being used for work, school, or just personal use. Given the media apps platform, it can be assumed that it was mainly personal use within this application. During the interview conducted, Participant 58 described that she does not think she is addicted to social media, although may be addicted to certain apps (i.e. TikTok). She said she preferred social media apps that did not involve interacting with friends or others directly online.
Comparison 4: FOMO in Interviews
A comparison can be made between the first and second interview participants, as they both displayed a number of these symptoms, but had a different view on whether they were actually addicted to social media. The first interviewee highlighted that social media has been more prevalent in his life since the beginning of the Covid-19 pandemic, and that fear of missing out (FOMO) is a big reason he feels tied to social media. He stated that if all social media was inaccessible for the day, it would have an extremely positive effect on his life, and when presented with a definition and explanation of social media addiction, he expressed that he feels as though addiction is a spectrum and that he may fall somewhere along the spectrum, as he has certain qualities of social media addiction. Interestingly, the second interviewee indicated that although she finds herself using social media the most when she’s supposed to be doing other things according to the survey, she feels as though she is “for the most part not dependent on social media” but rather, uses her phone for stress relief and humour. Contrary to the first interviewee’s FOMO as a cause of social media attachment, this participant expressed that she does not feel a need to keep up with what’s trending, and instead prefers to use apps such as TikTok, that require minimal amounts of direct social interaction. She stated that she would not consider herself addicted to social media, but rather a frequent, but responsible, user of certain social media platforms.
Recommendations for Future Research
Recommendation 1: Create an Official DSM-5 Definition for Social Media Addiction
More research on this topic will be possible once social media addiction is officially recognized as a psychological disorder under the DSM-5. Once it is a classified disorder, there will be criteria that mental health professionals can use to diagnose patients as suffering from social media addiction (SMA). This will allow for more formal research into this topic because a definite ‘yes’ or ‘no’ can be attributed to each participant in a study when it comes to SMA. As of right now, other conclusions can be made but it is difficult to come to a formal conclusion in relation to SMA. Furthermore, once it is a classified disorder, there will be psychologists who specialize in this type of addiction who can contribute to the discussion surrounding this area of research.
Recommendation 2: Location, Age, and Sequential Designs
This research study examined the social media habits, behaviours, and perceptions of young adults, aged 18-24 in the Edmonton and surrounding area. It would be beneficial for future researchers to study other locations, either locally or globally, to compare or contrast a variety of results. The age range of the sample was chosen due to the likelihood of young adults actively participating on social media. Future research should examine other age ranges and how they are affected by social media usage and addiction. By conducting sequential research methods of different age ranges, future researchers can determine indicators at each life stage that could be attributed to SMA. A cross-sectional research design would collect a sample from a variety of age ranges at one point in time, to draw inferences about SMA and age at that current time (Merrigan et al., 2012). A longitudinal-panel study would collect SMA data at multiple different points of time in a participant’s life (Merrigan et al., 2012). By collecting data over time with consistent participants, researchers could determine the likelihood of SMA in different life stages.
Recommendation 3: Long-term Effects of Excessive Smartphone and Social Media Use
The smartphone era has forced on us the need to always be connected and never truly shut down or log off. Although it has been widely studied and concluded that excessive use of social media has negative consequences on the lives of many, it would be interesting for future studies to research what long-term effects channelling so much time and energy into devices will cause. According to Larry Rosen, psychology professor and author of The Distracted Mind, “A lot of [phone usage] is unconscious behavior, … You shift from Facebook to Instagram, to checking the weather, to texts” (D’Onfro, 2018, para. 11). He suggests that an incredibly simple way to cut down on distractions is to turn off push notifications for as many apps as possible and install an app that tracks smartphone habits so usage goals can be set and met. Throughout this current research study, several short-term effects of social media addiction were discussed, such as phone-induced anxiety, poor academic performance, and stress. In the future, research studies could further explore the long-term effects of the overuse of smartphones and social media on physical, social, mental, and intellectual well-being. Establishing these long-term effects will make people more aware of their social media use habits, which may contribute to the prevention or reduced risk of being affected by these issues.
References
Addiction Center. (n.d.) Social Media Addiction. Addiction Center. https://www.addictioncenter.com/drugs/social-media-addiction/#:~:text=Social%20media%20addiction%20is%20a%20behavioral%20addiction%20that,media%20that%20it%20impairs%20other%20important%20life%20areas
Anderson, K. J. (2001). Internet use among college students: an exploratory study. J Am Coll Health, 50(1), 21–26. https://doi.org/10.1080/07448480109595707
Andreassen, C. S., Torsheim, T., Brunborg, G. S., & Pallesen, S. (2012). Development of a Facebook Addiction Scale. Psychological Reports, 110(2), 501–517. https://doi.org/10.2466/02.09.18.PR0.110.2.501-517
Andrews, T. (2020, March 24). Our iPhone weekly screen time reports are through the roof, and people are ‘horrified’. The Washington Post. https://www.washingtonpost.com/technology/2020/03/24/screen-time-iphone-coronavirus-quarantine-covid/.
Błachnio, A., Przepiorka, A., & Pantic, I. (2016). Association between Facebook addiction, self-esteem and life satisfaction: A cross-sectional study. Computers in Human Behavior, 55, 701–705. https://doi.org/10.1016/j.chb.2015.10.026
Cao, X., Gong, M., Yu, L., & Dai, B. (2020). Exploring the mechanism of social media addiction: an empirical study from WeChat users. Internet Research, 30(4), 1305–1328. https://doi.org/10.1016/j.chb.2019.03.034
Caplan, S. E. (2002). Problematic Internet use and psychosocial well-being: Development of a theory-based cognitive-behavioral measurement instrument. Computers in Human Behavior, 18(5), 553–575. https://doi.org/10.1016/S0747-5632(02)00004-3
Chan, M. (2013). Mobile phones and the good life: Examining the relationships among mobile use, social capital and subjective well-being. New Media & Society, 17(1), 96–113. https://doi.org/10.1177/1461444813516836
Chen, A. (2019). From attachment to addiction: The mediating role of need satisfaction on social networking sites. Computers In Human Behavior, 98, 80-92. https://doi.org/10.1016/j.chb.2019.03.034
Ciplak, E. (2020). Variables predicting social media addiction: Narcissism, happiness and average weekly time spent on social media. International Online Journal of Educational Sciences, 12(5), 48–58. https://doi.org/10.15345/iojes.2020.05.005
Cohen, S., Kamarck, T.P., & Mermelstein, R.J. (1983). A global measure of perceived stress. Journal of health and social behavior, 24(4), 385–396. https://doi.org/10.2307/2136404
American Psychiatric Association (n.d.). Diagnostic and statistical manual of mental disorders (DSM–5-TR). American Psychiatric Association. https://www.psychiatry.org/psychiatrists/practice/dsm.
Diener, E., Emmons, R.A., Larsen, R.J., & Griffin, S. (1985). The Satisfaction With Life Scale. Journal of personality assessment, 49(1), 71–5. https://doi.org/10.1207/s15327752jpa4901_13
D’Onfro, J. (2018, January 3). These simple steps will help you stop checking your phone so much. CNBC. https://www.cnbc.com/2018/01/03/how-to-curb-you-smartphone-addiction-in-2018.html
D’Souza, D. (2021, July 22). What is TikTok? Investopedia. https://www.investopedia.com/what-is-tiktok-4588933.
Farnsworth, B (2019, August 29). What is Participant Bias? (And How to Defeat it). iMotions. www.imotions.com/blog/participant-bias/.
Felce, D. (2010). Defining and applying the concept of quality of life. Journal of Intellectual Disability Research, 41, 126–135. doi: 10.1111/j.1365-2788.1997.tb00689.x
Felman, A. (2021, June 3). Addiction: Definition, symptoms, withdrawal, and treatment. Medical News Today. https://www.medicalnewstoday.com/articles/323465
Galloway, A. (2005). Non-probability sampling. Encyclopedia of Social Measurement, 2, 859–864. https://doi.org/10.1016/b0-12-369398-5/00382-0
Gao L, Gan Y, Whittal A, Lippke S. (2020) Problematic Internet Use and Perceived Quality of Life: Findings from a Cross-Sectional Study Investigating Work-Time and Leisure-Time Internet Use. Int J Environ Res Public Health, 17(11), 4056. https://doi.org/10.3390/ijerph17114056
Gosain, P., & Yadav, K. (2020). A study on social media usage and fear of missing out (FOMO) among youngsters. Journal of Studies in Social Sciences and Humanities, 6(2), 76–87. http://www.jssshonline.com/wp-content/uploads/2020/07/JSSSH_Vol.6_No.2_2020_76-87_Sr.-No.-4.pdf.
Goswami, H. (2012). Social relationships and children’s subjective well-being. Social Indicators Research, 107(3), 575–588. https://doi.org/10.1007/s11205-011-9864-z
History of Technology. (n.d.) Information Age. History of Technology. https://historyoftechnologyif.weebly.com/information-age.html
Jackson, S., Jacobs, S., Burrell, N., & Allen, M. (1986). Characterizing ordinary argument: Substantive and methodological issues. Journal of American Forensic Association, 23(1), 42–57. https://doi.org/10.1080/00028533.1986.11951329
Jie, T., Yizhen, Y., Yukai, D., Ying, M., Dongying, Z., & Jiaji, W. (2014). Addictive Behaviors Prevalence of internet addiction and its association with stressful life events and psychological symptoms among adolescent internet users. Addictive Behaviors, 39(3), 744–747. https://doi.org/10.1016/j.addbeh.2013.12.010
Klimmt, C., Hefner, D., Reinecke, L., Rieger, D., & Vorderer, P. (2018). The permanently online and permanently connected mind. Mapping the cognitive structures behind mobile Internet use. In P. Vorderer, D. Hefner, L. Reinecke & C. Klimmt (Eds.), Permanently online, permanently connected. Living and communication in a POPC world (pp. 18-28). Routledge. https://www.researchgate.net/publication/319623005_The_permanently_online_and_permanently_connected_mind_Mapping_the_cognitive_structures_behind_mobile_internet_use
Kormoczi, R. (2020, June 24). What is the Digital Age? Times International. https://timesinternational.net/the-digital-age/#:~:text=%20How%20will%20the%20Digital%20Age%20impact%20our,the%20most%20evident%20concerns%20is%20the…%20More%20
Kwon, M., Kim, D.-J., Cho, H., & Yang, S. (2013). The smartphone addiction scale: development and validation of a short version for adolescents. PLOS ONE, 8(12), e83558. https://doi.org/10.1371/journal.pone.0083558
Larson, L. (2021). Social media use in emerging adults: Investigating the relationship with social media addiction and Social Behavior. Psi Chi Journal of Psychological Research, 26(2), 228–237. https://doi.org/10.24839/2325-7342.jn26.2.228
Lin C.-Y., Broström, A., Nilsen, P., Griffiths, M. D., & Pakpour, A.H. (2017). Psychometric validation of the Persian Bergen Social Media Addiction Scale using classic test theory and Rasch models. Journal of Behavioral Addictions, 6(4), 620–629. https://doi.org/10.1556/2006.6.2017.071
Lee, E., Ho, S., & Lwin, M. (2016). Explicating problematic social network sites use: A review of concepts, theoretical frameworks, and future directions for communication theorizing. New Media & Society, 19(2), 308–326. https://doi.org/10.1177/1461444816671891
Ling, R. (2012). Taken for grantedness. The embedding of mobile communication into society. MIT Press.
McCambridge, J., de Bruin, M., & Witton, J. (2012). The Effects of Demand Characteristics on Research Participant Behaviours in Non-Laboratory Settings: A Systematic Review. PLOS ONE, 7(6), e39116. https://doi.org/10.1371/journal.pone.0039116
Merriam-Webster. (n.d.). Addicted. In Merriam-Webster.com dictionary. Retrieved September 15, 2022, from https://www.merriam-webster.com/dictionary/addicted
Merriam-Webster. (n.d.). Social media. In Merriam Webster.com dictionary. Retrieved September 15, 2022, from https://www.merriam-webster.com/dictionary/social%20media
Merrigan, G., Huston, C. L., & Johnston, R. (2012). Communication Research Methods: Canadian Edition. Oxford University Press.
Nakaya, A. (2015). Internet and social media addiction. ReferencePoint Press. https://www.webology.org/abstract.php?id=277
National Institutes of Health. (n.d.) Dependent and independent variables. U.S. National Library of Medicine. Retrieved September 21, 2022, from https://www.nlm.nih.gov/nichsr/stats_tutorial/section2/mod4_variables.html
Ofir Turel & Alexander Serenko (2012) The benefits and dangers of enjoyment with social networking websites. European Journal of Information Systems, 21(5), 512–528. https://doi.org/10.1057/ejis.2012.1
Pang, H. (2018a). How does time spent on WeChat bolster subjective well-being through social integration and social capital? Telematics and Informatics, 35(8), 2147–2156. https://doi.org/10.1016/j.tele.2018.07.015
Pang, H. (2018b). Exploring the beneficial effects of social networking site use on Chinese students’ perceptions of social capital and psychological well-being in Germany. International Journal of Intercultural Relations, 67, 1–11. https://doi.org/10.1016/j.ijintrel.2018.08.002
Ponnusamy, S., Iranmanesh, M., Foroughi, B., & Hyun, S. S. (2020). Drivers and outcomes of Instagram addiction: Psychological well-being as moderator. Computers in Human Behavior, 107, 106294. https://doi.org/10.1016/j.chb.2020.106294.
Przybylski, A. K., Murayama, K., DeHaan, C. R., & Gladwell, V. (2013). Motivational, emotional, and behavioral correlates of fear of missing out. Computers in Human Behavior, 29(4), 1841–1848. https://doi.org/10.1016/j.chb.2013.02.014
Sam, N. (2013). Social skills. Psychology Dictionary. https://psychologydictionary.org/social-skills/
Samaha, M., & Hawi, N. S. (2016). Relationships among smartphone addiction, stress, academic performance, and Satisfaction With Life. Computers in Human Behavior, 57, 321–325. https://doi.org/10.1016/j.chb.2015.12.045
Smith, J. (2021, July 5). Internet Addiction: Causes, Effects, And Treatments. AddictionResource.net. https://www.addictionresource.net/behavioral-addictions/internet/
Statista Research Department. (2021, September 7). Daily Social Media Usage Worldwide 2012-2021. Statista. https://www.statista.com/statistics/433871/daily-social-media-usage-worldwide/
Statista Research Department. (2021, November 16). Most used social media 2021. Statista. https://www.statista.com/statistics/272014/global-social-networks-ranked-by-number-of-users/.
Sun, Y., & Zhang, Y. (2021). A review of theories and models applied in studies of social media addiction and implications for future research. Addictive Behaviors, 114, 106699. https://doi.org/10.1016/j.addbeh.2020.106699
Swar, B., & Hameed, T. (2017, February). Fear of Missing out, Social Media Engagement, Smartphone Addiction and Distraction: Moderating Role of Self-Help Mobile Apps-based Interventions in the Youth [Paper presentation]. 10th International Conference on Health Informatics, Porto, Portugal. https://pdfs.semanticscholar.org/d2e4/64a501b7c7a9c50be808803cb558758bdfbe.pdf.
Tang, J. H., Chen, M. C., Yang, C. Y., Chung, T. Y., & Lee, Y. A. (2016). Personality traits, interpersonal relationships, online social support, and Facebook addiction. Telematics and Informatics, 33(1), 102–108. https://doi.org/10.1016/j.tele.2015.06.003
Tarafdar, M., Maier, C., Laumer, S., & Weitzel, T. (2019). Explaining the link between technostress and technology addiction for social networking sites: A study of distraction as a coping behavior. Information Systems Journal, 30(1), 96–124. https://doi.org/10.1111/isj.12253
Techopedia. (2017, April 26). Social Platform. Techopedia. https://www.techopedia.com/definition/23759/social-platform
Tutgun Ünal, A. & Deniz, L. (2015). Development of the Social Media Addiction Scale. AJIT-e Online Academic Journal of Information Technology, 6(21), 51–70. https://doi.org/10.5824/1309-1581.2015.4.004.x
United Nations Department of Economic and Social Affairs. (2021). Definitions of Youth. United Nations Youth. https://www.un.org/esa/socdev/documents/youth/fact-sheets/youth-definition.pdf
Wacks, Y., & Weinstein, A. M. (2021). Excessive Smartphone Use Is Associated With Health Problems in Adolescents and Young Adults. Frontiers in Psychiatry, 12, 1–7. https://dx.doi.org/10.3389%2Ffpsyt.2021.669042
Wang, J. L., Jackson, L. A., Gaskin, J., & Wang, H. Z. (2014). The effects of social networking site (SNS) use on college students’ friendship and well-being. Computers in Human Behavior, 37, 229–236. https://doi.org/10.1016/j.chb.2014.04.051
Webster, Merriam. (2021). Merriam-Webster Online Dictionary. https://www.merriam-webster.com/
Young adult. (2022) in Cambridge Dictionary. Cambridge University Press. https://dictionary.cambridge.org/dictionary/english/young-adult
Zhao, L. (2021). The impact of social media use types and social media addiction on subjective well-being of college students: A comparative analysis of addicted and non-addicted students. Computers in Human Behavior Reports, 4, 100122. https://doi.org/10.1016/j.chbr.2021.100122
Appendix A
Blank Survey

Figure A1. Survey explanation and disclaimers.
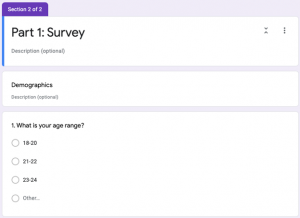
Figure A2. Survey question one and response options.

Figure A3. Survey question two and response options.
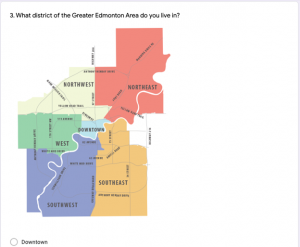
Figure A4. Survey question three with one response option.
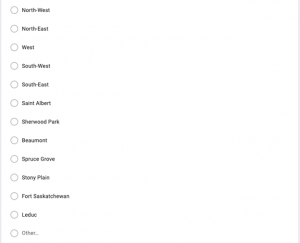
Figure A5. Survey question three’s response options.
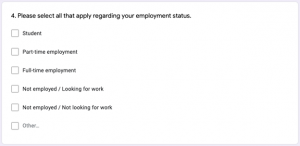
Figure A6. Survey question four and response options.

Figure A7. Survey question five and six and response options.
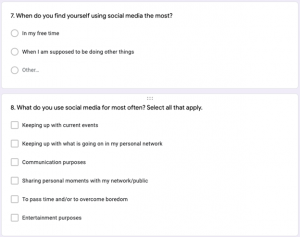
Figure A8. Survey question seven and eight and response options.

Figure A9. Survey question nine and 10 and response options.
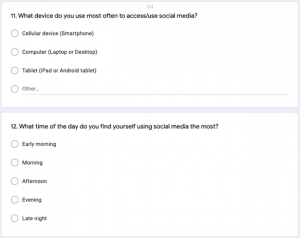
Figure A10. Survey question 11 and 12 and response options.
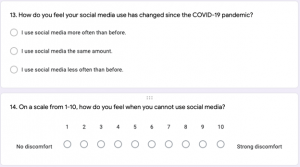
Figure A11. Survey question 13 and 14 and response options.

Figure A12. Survey question 15 and response options.
A person who is in his or her late teenage years or early twenties (Cambridge Dictionary, 2022)
Exhibiting a compulsive, chronic, physiological, or psychological need for a habit-forming substance, behaviour, or activity (Merriam-Webster, n.d.)
Forms of electronic communication . . . through which users create online communities to share information, ideas, personal messages, and other content (such as videos) (Merriam-Webster, n.d.)
A behavioural addiction that is defined by being overly concerned about social media, driven by an uncontrollable urge to log on to or use social media, and devoting so much time and effort to social media that it impairs other important life areas (Addiction Center, n.d.)
A research method used to collect information from a group of people regarding a specific topic
A respiratory disease that, when contracted, can affect an individual’s breathing and/or sense of smell and taste (Johns Hopkins Medicine, 2020, para, 7–8)
Our emotional, psychological, and social well-being. Mental health affects how we think, feel, and act. It also helps determine how we handle stress, relate to others, and make choices (mentalHealth.gov, 2020, para. 1)
What happens as a result of the independent variable (National Library of Medicine, n.d.)
What we expect will influence dependent variables (National Library of Medicine, n.d.)
Diagnostic and Statistical Manual of Mental Disorders: authoritative volume that defines and classifies mental disorders in order to improve diagnoses, treatment, and research by hundreds of international experts in all aspects of mental health (American Psychiatric Association, 2021)
