Conclusions
Conclusions
Table 9
List of Compiled Stressed Indices (SIs)
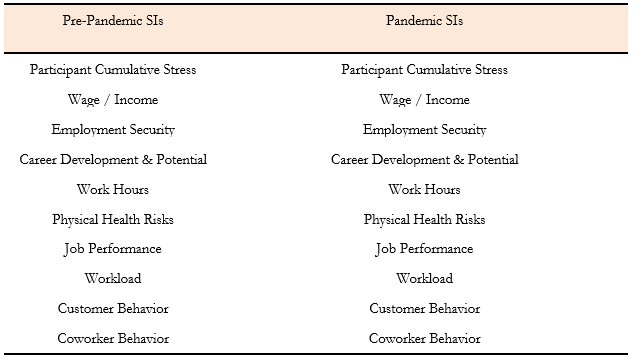
To analyze the survey results, researchers compared the responses to questions six and seven (Table 5). However, the data first needed to be converted into a form that could be efficiently analyzed. To do so, each potential response was given a numerical value between zero and four with “Not stressful” being zero and “Extremely stressful” being four. The responses to the two questions were converted into integer values and totalled to create a number of stress indices (SIs) (Table 9). These indices provide approximate representations of stress levels. It should be noted that appending numerical values to what are, ultimately, subjective classifications introduce a significant margin for error. Therefore, these indices should be considered estimates rather than concrete data.
Two sets of SIs were created. The first set contains a pre-pandemic and pandemic SI for each of the 34 participants and was made using values from all work-related challenges (Figure 2). The second set contains a pre-pandemic and pandemic SI for each work-related challenge (work hours, workload, etc.) and was made using values reported by all participants (Figure 4).
Figure 2
Comparing Participant Cumulative SIs
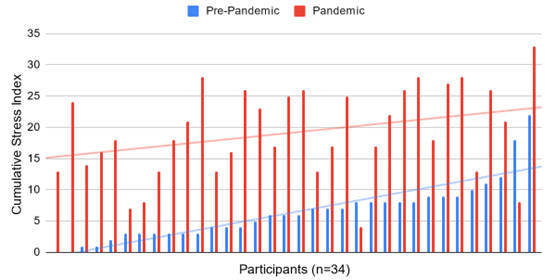
Figure 2 provides a visualization of the 68-participant cumulative SIs. In it, the change in participants’ overall stress levels can be seen by comparing their pre-pandemic and pandemic cumulative SIs. Figure 2 additionally illustrates how pre-pandemic stress levels correlate with pandemic stress levels via the trendlines.
It is clear that stress levels during the pandemic far exceed stress levels prior to the pandemic in most cases. This is consistent with the researchers’ expectations. However, there appears to be only a small correlation between pre-pandemic stress levels and pandemic stress levels. It was found that participants who reported high pre-pandemic stress levels were, on average, only slightly more likely to report high pandemic stress levels than participants who had reported low or moderate pre-pandemic stress. However, despite the implications of the trendlines, the actual changes in stress levels vary significantly.
Figure 3
Job Satisfaction Rating Compared to Pandemic Participant Cumulative SI
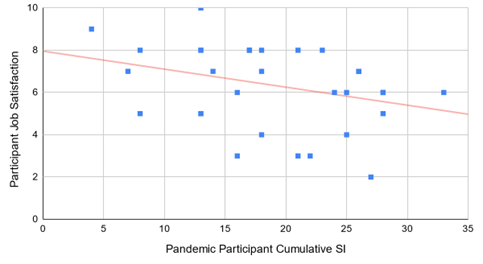
Participants’ pandemic cumulative SIs were compared against their reported job satisfaction scores (Figure 3). It was found that job satisfaction decreased as stress levels increased. However, this was on average. In actuality, there is, once again, a diverse range of responses, indicating that there are likely other variables at play that this survey did not focus on.
However, a correlation was established between participants’ job satisfaction and perceptions of their mental health. As previously explained, the average job satisfaction score among all participants was 6.32 / 10 (see Figure 1). But among those who reported an improvement in their mental health, those who reported no noticeable change, and those who were unsure, the average job satisfaction score was 7.80 / 10—a marked increase (see Table 6).
Figure 4
Comparing Work-Related Challenge SIs

Figure 4 visualizes the SIs for each work-related challenge included in questions 6 and 7 (see Table 5). Before the pandemic, customer behavior was highlighted as the most stressful part of working in a restaurant, and this has remained true during the pandemic as well. However, the challenges that saw the largest increases in stress were physical health risks followed closely by employment security with income and work hours not far behind. The challenges that were least affected by theCovid-19 pandemic were workload and performance.
Although no benefit correlation was proven in this study, mental health issues are usually treated by making use of available mental health supports. In the survey, the researchers examined whether restaurant workers make use of mental health support. In question 10, 21 out of 34 participants reported use of mental health support products and/or services. Unfortunately, these products and services are not free, and as the researchers discovered, most employers do not provide benefits that cover mental health support. Out of 34 participants, 26 stated that their employer did not provide mental health coverage or benefits. These results are a microcosm of a worrying problem. Ensuring that employees are well taken care of and have access to mental health services is a logical way to boost morale in the workplace. Although recommended, the researchers found no correlations regarding mental health support use or knowledge of mental health benefits in this study.
