1.1 What is Statistics?
Statistics is a branch of science dealing with the collection, analysis, interpretation, and presentation of masses of data. Therefore, statistics is all about data, and data is information organized in variables. Data are evidence and statistics are tools that provide valid and effective ways to collect evidence. Hence, statistics is widely used in many areas to find useful patterns, make predictions, and hence help in decision-making.
STAT 151 covers the three major topics of statistics. For now, we only provide the general idea and more details will be provided as the course progresses.
- Data collection is about how to collect data. Common data collection methods include sampling surveys, observational studies, and designed experiments. Data collection is not a key focus of STAT 151, so students are only required to have a basic idea about simple random sampling, designed experiments, and observational studies.
- Data presentation is about how to present data. It includes numerical methods such as tables, mean, standard deviation, and five-number summary; and graphical methods such as histograms, boxplots, scatter plots, pie charts, and bar charts. Most data presentation techniques are parts of the subfield of statistics known as descriptive statistics.
- Data analysis and interpretation is the process of analyzing data and summarizing data so that useful information can be uncovered; such information acts as the basis for sound decision-making. Methods covered in STAT 151 include confidence intervals, hypothesis testing, and simple linear regression.
In the first part of the course, we will introduce some essential terminologies in statistics.
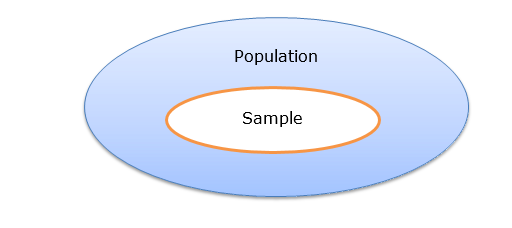
- Population is the collection of all individuals or items under consideration in a statistical study.
- Sample is part of the population from which information is obtained. It is a subset of the population.
Figure 1.1 illustrates the relationship between population and sample. The outside (bigger) ellipse represents the population and the inside (smaller) ellipse represents the sample. In general, we usually handle sampled data, since it is generally impractical or even impossible to collect data from the entire population.

Basically, there are two types of statistics:
- Descriptive statistics consists of numerical and graphical methods for organizing and summarizing data. Note that descriptive statistics focuses only on data and do not generalize the conclusions from the sample to the population.
- Inferential statistics consists of methods for drawing conclusions about a population based on information obtained from sampled data. Inferential statistics includes estimation, decision making, prediction, and other generalizations about a population. For inferential studies, look for the key words such as “estimate for all” or “prediction for all.”

Complete this exercise to see if you understand these basic concepts.
A random sample of 100 students studying at MacEwan University yields 65/35 as an estimate of the ratio of females to males for all students studying at MacEwan.
Answer the following questions related to the above study.
- What is the population?
- What is the sample?
- Is this study descriptive or inferential?
Show/Hide Answer
- All students studying at MacEwan.
- Those 100 students randomly selected.
- Inferential, the ratio 65/35 is based on the sample but used as an estimate of the population ratio.
Note: If you see the key words “estimate for all” in the question, it is usually an inferential study.

