3.3 Relationship Between Events and Venn Diagrams
Given events E, A, and B, we can construct new events using the compliment, intersection and union operations:
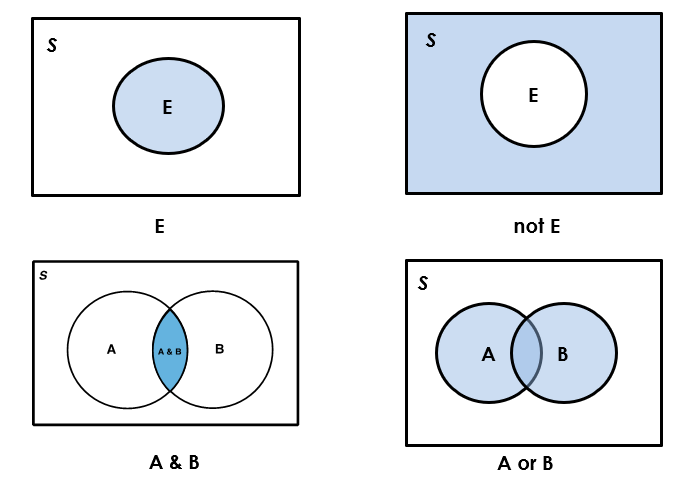
- The complement of event E is the event in which E does not occur. The compliment of E is denoted by Ec, or simply “not E”.
- The intersection of events A and B is the event in which both A and B occur. The intersection of A and B is denoted by A [latex]\cap[/latex] B, or A & B, or simply “A and B”.
- The union of events A and B is the event in which we observe one of the following: A and B both occur, A occurs but B does not, or A does not occur but B does. The union of A and B is denoted by A [latex]\cup[/latex] B or simply “A or B”.
Two events are mutually exclusive if they do not overlap, i.e., they do not have outcomes in common. If two events A and B are mutually exclusive, they cannot occur at the same time; therefore [latex]A \cap B=\varnothing[/latex] and hence [latex]P(A \cap B ) = 0[/latex].
Example: Relationship Between Events and Mutually Exclusive
Suppose we roll a fair die, so that the sample space is [latex]S[/latex]= {1, 2, 3, 4, 5, 6}. Consider the following events:
- Observing an even number, A = {2, 4, 6}
- Observing an outcome that is at most 3, B = {1, 2, 3}
- Observing an outcome that is at least 5, C = {5, 6}
- Define and list all possible outcomes of the following events:
- (not A): observing an odd number, not A = {1, 3, 5}
- (A & B): observing an even number that is at most 3, A & B={2}. The only element in the overlap of events A and B, the common element in both the sets of A and B is 2.
- Are the events A and B mutually exclusive?
No, the overlap is {2}, not an empty set. Therefore, events A and B are NOT mutually exclusive.
3. Are the events B and C mutually exclusive?
Yes, the don’t overlap, i.e., there is no common element in both B and C. Therefore, events B and C are mutually exclusive, i.e., [latex]\mbox{ B & C}=\varnothing[/latex].
We can use a Venn diagram to show relationships between events. In a Venn diagram, the sample space [latex]S[/latex] is represented by a rectangle, events are often represented by circles, and events of interest are indicated by a shaded area. The following graphs show the Venn diagrams for the events E, (not E), (A & B), and (A or B) respectively.

It is straightforward to confirm the basic properties of the probability of an event based on the Venn diagrams:
- The total area of the rectangle is 1, which means [latex]P(S) = 1[/latex].
- The probability of the event E is the shaded area, between 0 and 1, which means [latex]0 \leq P(E) \leq 1[/latex] and [latex]P(\varnothing) = 0[/latex].
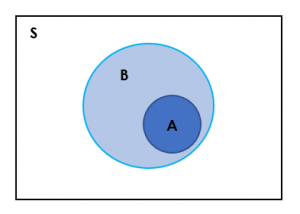
- If event A is a subset (part of) of event B (See Figure 3.3), denoted by [latex]A \subseteq B[/latex], then [latex]P(A) \leq P(B)[/latex]. For example, observe in the above diagrams that [latex]A \: \& \: B \subseteq A[/latex] and [latex]A \: \& \: B \subseteq B[/latex]. From this, it is easy to see that it is always true that [latex]P(A \: \& \: B) \leq P(A)[/latex] and that [latex]P(A \: \& \: B) \leq P(B)[/latex].

Figure 3.3 Event A is a Subset of Event B. [Image Description (See Appendix D Figure 3.3)] - For any two events A and B, since [latex]A\subseteq (A \mbox{ or } B)[/latex], we have [latex]P(A)\le P(A \mbox{ or } B)[/latex]. Similarly, [latex]B\subseteq (A \mbox{ or } B)[/latex], we have [latex]P(B)\le P(A \mbox{ or } B)[/latex].

