13.5 Correlation Coefficient r
The correlation coefficient [latex]r[/latex] is calculated by
[latex]r = \frac{S_{xy}}{\sqrt{S_{xx} \times S_{yy}}}[/latex]
where
[latex]S_{xy} = \sum x_i y_i - \frac{\left( \sum x_i \right) \left( \sum y_i \right)}{n}, S_{xx} = \sum x_i^2 - \frac{\left( \sum x_i \right)^2}{n}, S_{yy} = \sum y_i^2 - \frac{\left( \sum y_i \right)^2}{n}.[/latex]
The correlation coefficient [latex]r[/latex] measures the association between the response variable [latex]y[/latex] and the predictor variable [latex]x[/latex] in the following three aspects:
- Pattern: The correlation coefficient [latex]r[/latex] measures linear association. Do NOT use the correlation coefficient [latex]r[/latex] to describe non-linear association.
- Strength: The closer [latex]r[/latex] is to either +1 or -1, the stronger the linear association. When [latex]r = \pm 1[/latex], [latex]y[/latex] and [latex]x[/latex] have a perfect linear association. That is, all the data points in the scatter plot of [latex]x[/latex] versus [latex]y[/latex] fall in a straight line.
- Direction: Positive or negative. Positive association [latex](r > 0)[/latex] means that [latex]y[/latex] and [latex]x[/latex] change in the same direction. That is [latex]y[/latex] increases (decreases) if [latex]x[/latex] increases (decreases). Negative association [latex](r < 0)[/latex] means that [latex]y[/latex] and [latex]x[/latex] change in the opposite direction, that is, [latex]y[/latex] increases (decreases) if [latex]x[/latex] decreases (increases).

Exercise: Correlation Coefficient
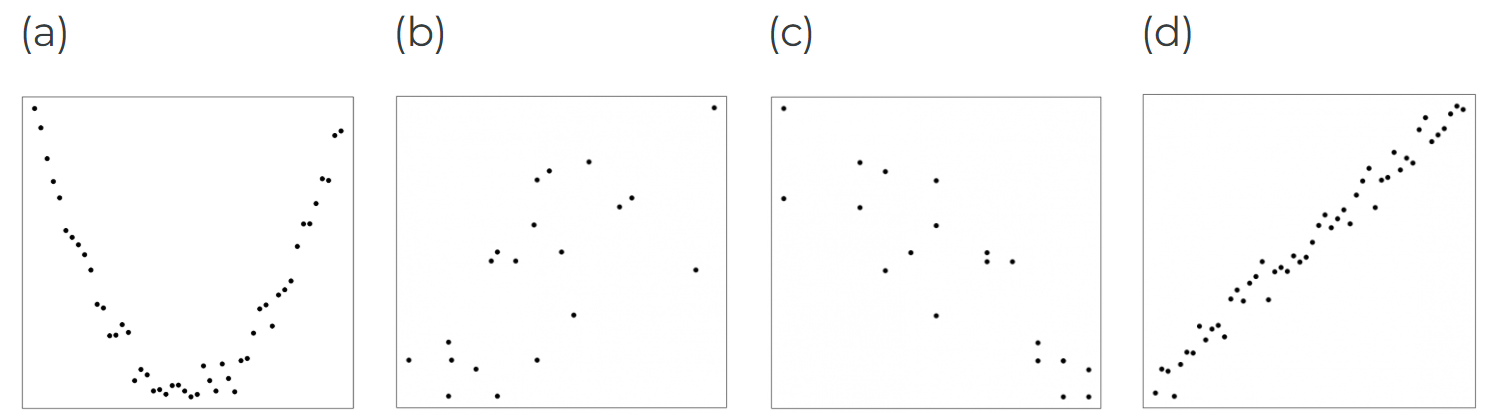
Match the following correlation coefficients with the scatter plots.
(1) 0.989 (2) 0.697 (3) -0.887 (4) -0.020
Show/Hide Answer
Answers:
- [latex]r=-0.020[/latex]. There is no linear association between [latex]y[/latex] and [latex]x[/latex], [latex]r[/latex] should be close to 0.
- [latex]r=0.697[/latex]. When [latex]x[/latex] increases, [latex]y[/latex] also increases. There should be a positive linear association between [latex]y[/latex] and [latex]x[/latex], i.e., [latex]r > 0[/latex]. But it is not extremely strong since the points show little semblance of a straight line.
- [latex]r=-0.887[/latex]. When [latex]x[/latex] increases, [latex]y[/latex] decreases. There should be a negative linear association between [latex]y[/latex] and [latex]x[/latex], i.e., [latex]r < 0[/latex]. The association is quite strong since the points are starting to resemble the rough appearance of a straight line.
- [latex]r=0.989[/latex]. When [latex]x[/latex] increases, [latex]y[/latex] also increases. There should be a positive linear association between [latex]y[/latex] and [latex]x[/latex], i.e., [latex]r > 0[/latex]. The association is extremely strong since the points are basically on a straight line.
Exercise: Concepts on Correlation Coefficient
Explain whether the following statements are true or false. Correct them if they are false.
- If [latex]r \approx 0[/latex], there is no association between [latex]y[/latex] and [latex]x[/latex].
- The larger the value of [latex]r[/latex], the stronger the association between [latex]y[/latex] and [latex]x[/latex].
Show/Hide Answer
- False. If [latex]r \approx 0[/latex], there is no linear association between[latex]y[/latex] and [latex]x[/latex].
- False. The larger the absolute value of [latex]r[/latex], the stronger the linear association. Or the closer [latex]r[/latex] is to +1 or -1, the stronger the linear association.
