5.4 Using the Standard Normal Table
The standard normal table (usually found in the appendix of a Statistics textbook) can be used to solve problems related to normal distributions.
5.4.1 Find the Area (Probability) for a Given Z-Score
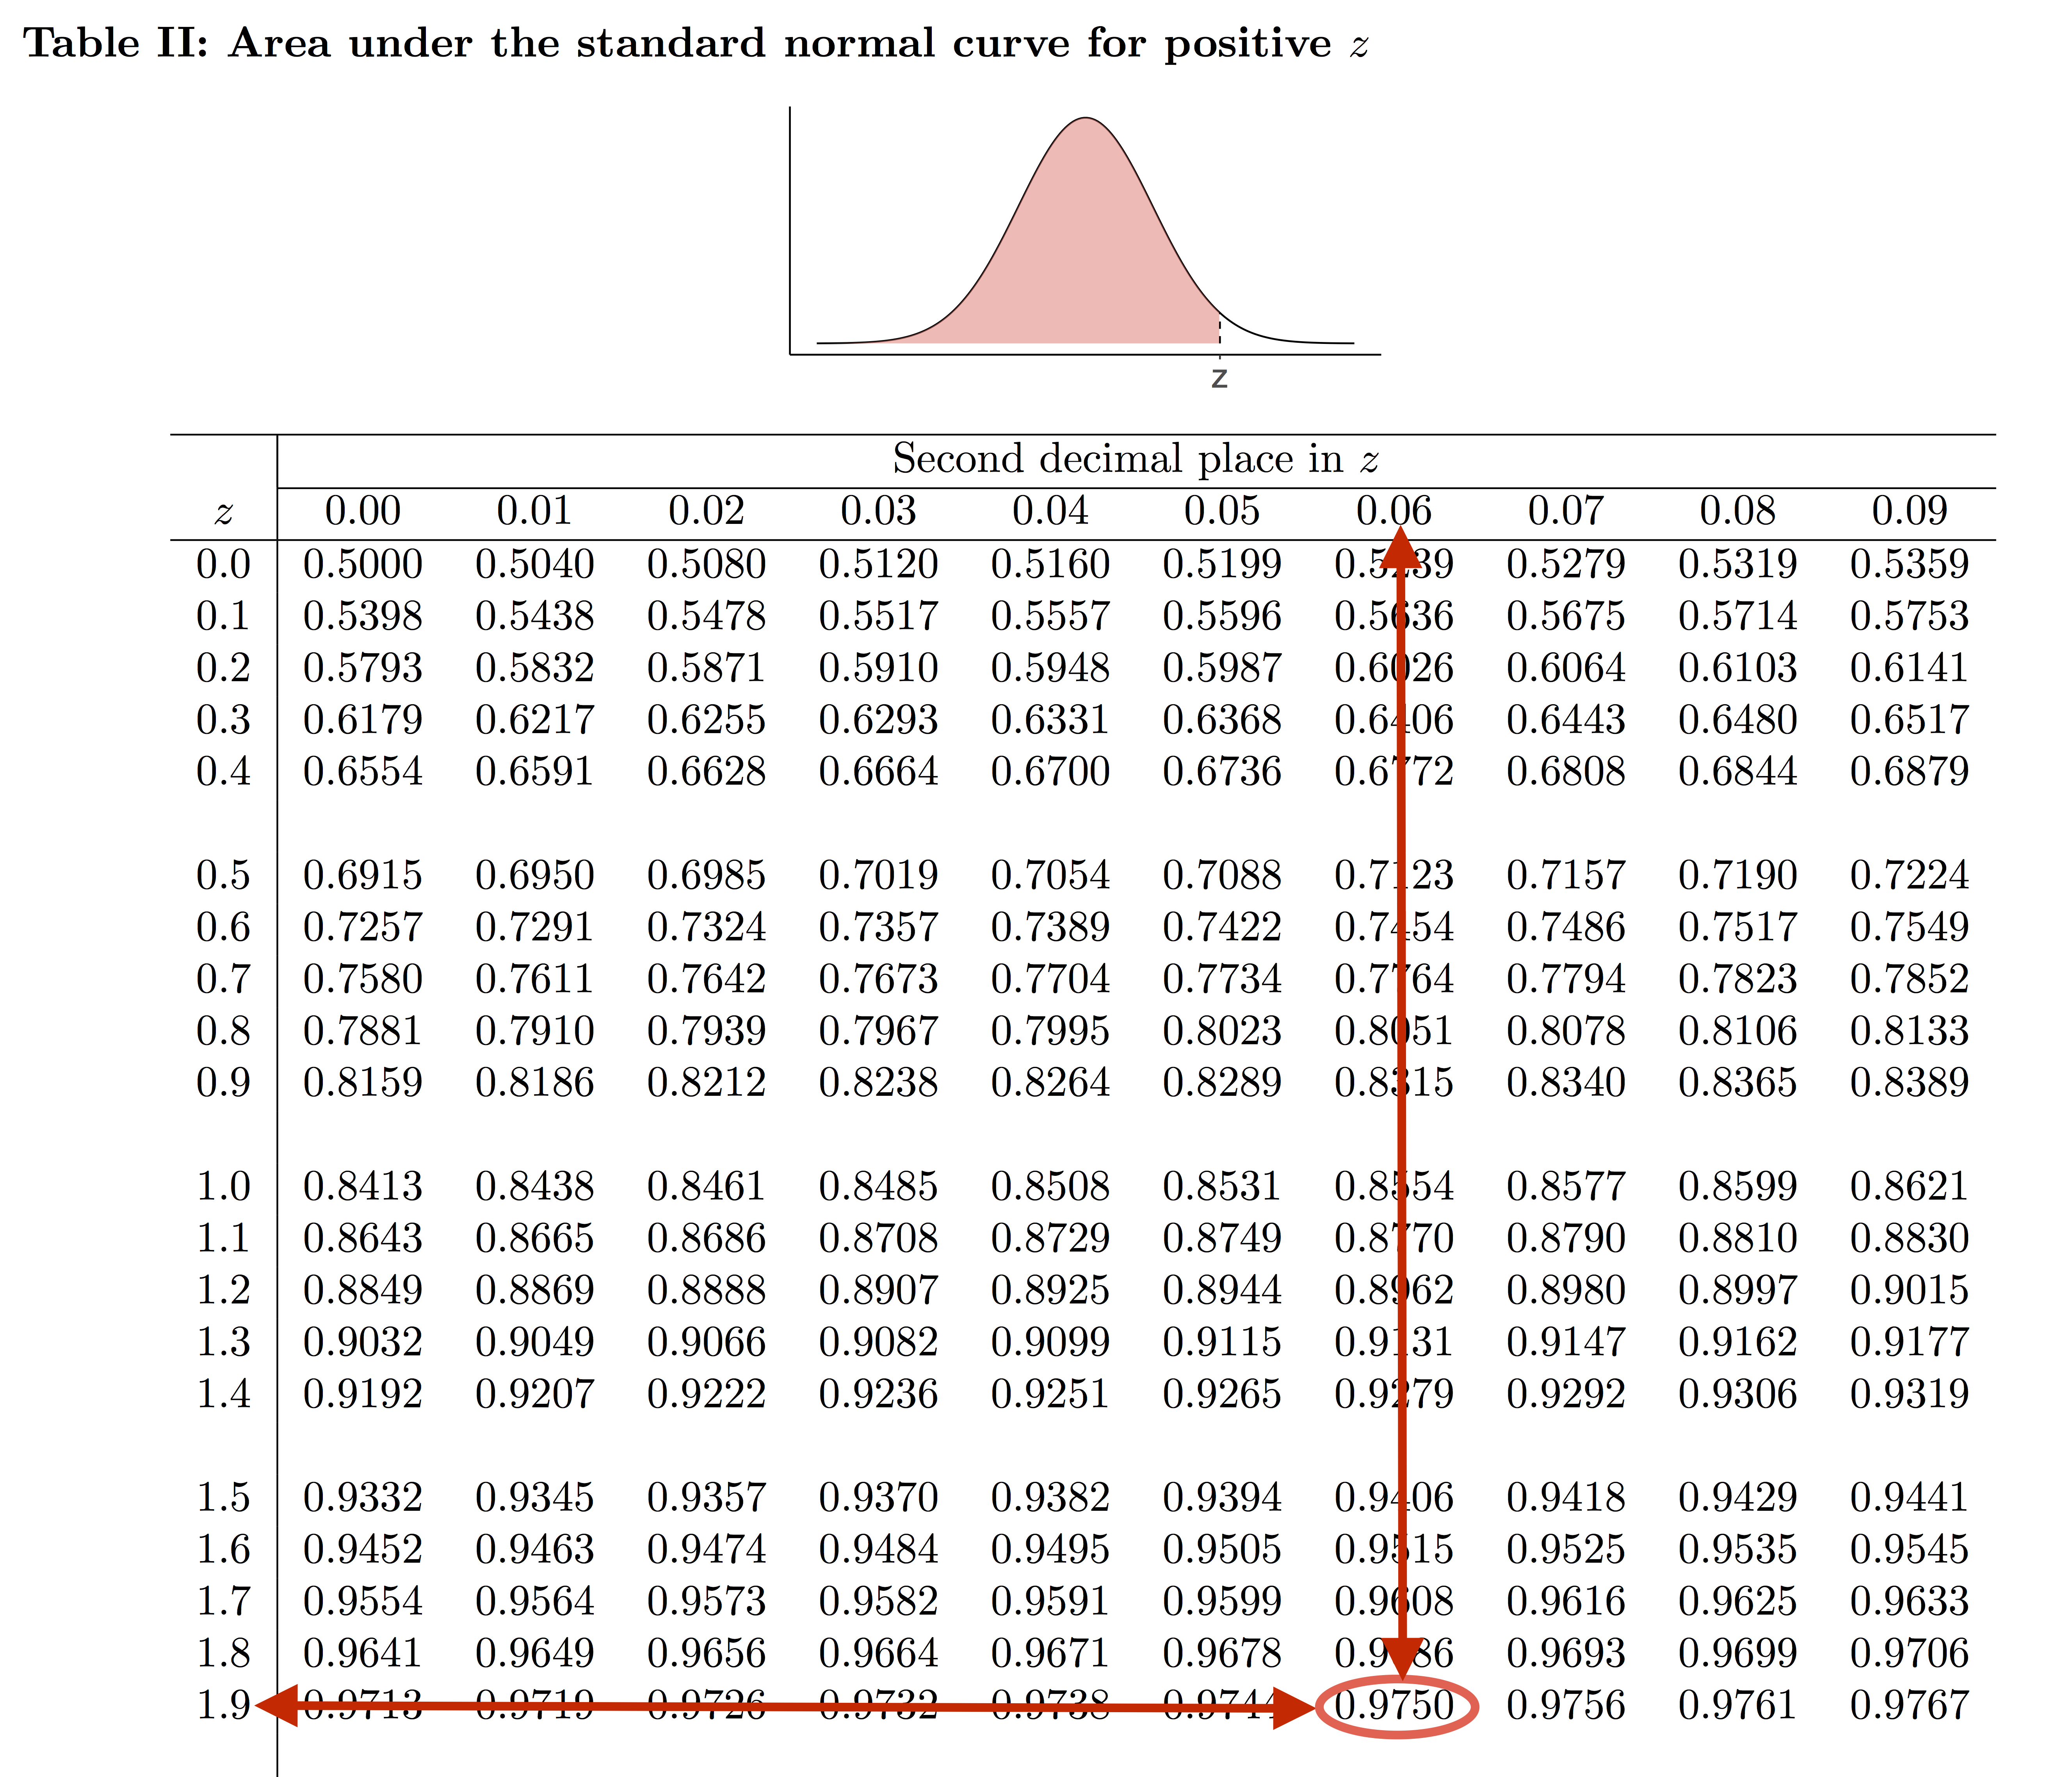
In general, the standard normal table gives the area under the standard normal curve to the left of a specified z-score. Using the table, we can calculate the area under the curve to the left of a z-score, to the right of a z-score, between two z-scores, or beyond two z-scores. Figure 5.6 shows that the area to the left of 1.96 under the standard normal curve is 0.975.
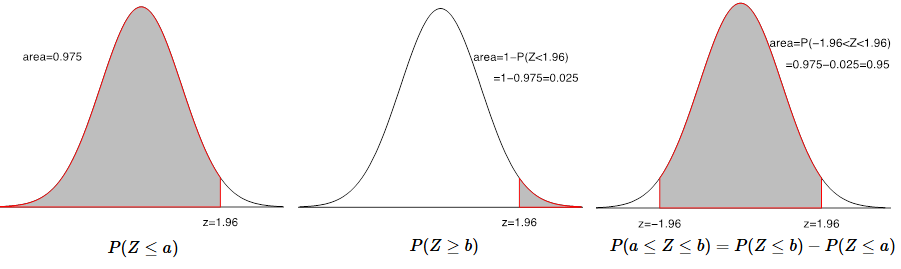
If random variable [latex]Z[/latex] follows a standard normal distribution, more detailed examples of using the standard normal table can be found in Figure 5.7:
- Left panel: the area to the left of 1.96 is 0.975, i.e., [latex]P(Z<1.96)=0.975.[/latex]
- Middle panel: the area to the right of 1.96 is 0.025. There are two ways to solve this problem:
- Recall that the total area under any density curve is one, the area to the right of 1.96 equals one minus the area to the left of 1.96, i.e, [latex]\begin{eqnarray*} P(Z>1.96)&=&\mbox{area under the standard normal curve to the right of 1.96}\\&=&1-\mbox{area under the curve to the left of 1.96}=1-0.975=0.025.\end{eqnarray*}[/latex]
- [latex]P(Z>1.96)=P(Z<-1.96)=0.025.[/latex] This is because the standard normal curve is symmetric at 0. The area to the right of 1.96 equals the area to the left of -1.96.
- Right panel: the area between -1.96 and 1.96 is 0.95, i.e., [latex]\begin{eqnarray*}P(-1.96 \lt Z \lt 1.96)&=&\mbox{area between -1.96 and 1.96}\\&=&(\mbox{area to the left of 1.96) - (area to the left of -1.96})\\&=&0.975-0.025=0.95.\end{eqnarray*}[/latex]
Example: Finding Areas Under Standard Normal Curve
Suppose that [latex]Z\sim N(0, 1)[/latex], follows a standard normal distribution.
1. Draw a graph to show and find [latex]P(Z<-2)[/latex].
We can find the area to the left of -2 using the standard normal table directly. [latex]P(Z<-2)=P(Z<-2.00)=0.0228.[/latex] Graph showing the area can be found in Panel (1) of Figure 5.6.
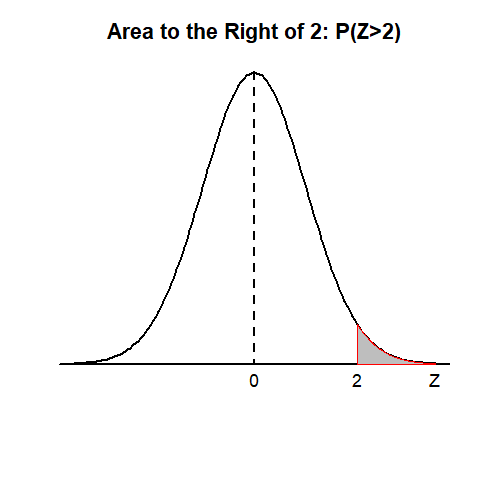
2. Draw a graph to show and find [latex]P(Z>2).[/latex]
This is the area to the right of 2. Recall that the table gives the area to the left of a [latex]z[/latex]-score. There are two ways to answer this question:
-
- Apply the symmetry property of the standard normal curve. The standard normal curve is symmetric at 0, and the area to the right of 2 equals the area to the left of -2. [latex]P(Z>2)=P(Z<-2)=0.0228.[/latex]
- Use the property of a density curve: all density curves have an area of one under the curve. The area to the right of 2 equals one minus the area to the left of 2. [latex]P(Z>2)=1-P(Z<2)=1-P(Z<2.00)=1-0.9772=0.0228.[/latex] Graph showing the area can be found in Panel (2) of Figure 5.8.
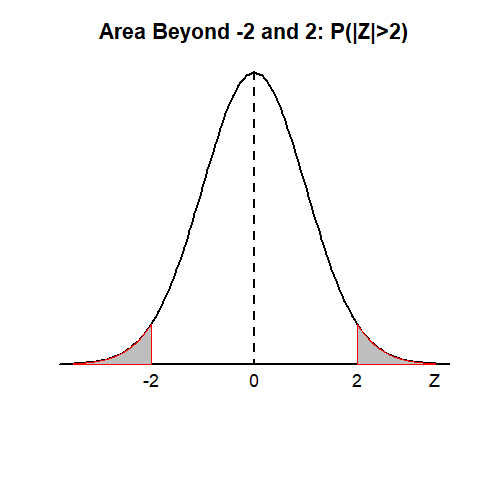
3. Draw a graph to show and find [latex]P(Z<-2 \mbox{ or } Z>2).[/latex]
Area beyond -2 and 2, i.e., to the left of -2 or to the right of 2. The two events {Z<-2} and {Z>2} don't overlap and, hence, are mutually exclusive; the special addition rule applies. [latex]P(Z<-2 \mbox{ or } Z>2)=P(Z<-2)+P(Z>2)=0.0228+0.0228=0.0456.[/latex] Graph showing the area can be found in Panel (3) of Figure 5.8.
4. Draw a graph to show and find [latex]P(-4 < Z < 5).[/latex]
The area between -4 and 5 equals the area to the left of 5 minus the area to the left of -4. P(-4<Z<5)=P(Z<5)-P(Z<-4)=1-0=1. Graph showing the area can be found in Panel (4) of Figure 5.8.
Note: the standard normal table gives the area (in four decimal places) to the left of the z-score between -3.90 and 3.90. Therefore, the area to the left of any z-score below -3.90 is 0, and the area to the left of any z-score above 3.90 is 1.

(1) |
(2) |
(3) |

(4) |
Figure 5.8: Graphs showing the areas under the standard normal curve corresponding to the probabilities in the example. [Image Description (See Appendix D Figure 5.8)] Click on the image to enlarge it.
5.4.2 Find the Z-Score for a Given Area (Probability)
We can use the standard normal table in another way: find the [latex]z[/latex]-score for a specified area or probability (percentage). The steps are as follows:
- Express the given area in terms of a left-tailed probability (or probabilities if there are 2 z-scores).
- Search the main body of the standard normal table for the closest value to the left-tailed probability.
- Obtain the [latex]z[/latex]-score that corresponds to the given area. If multiple values are equally close to the given left-tailed probability, take the average of their corresponding [latex]z[/latex]-scores.
Example: Given the Area, find the corresponding z-score
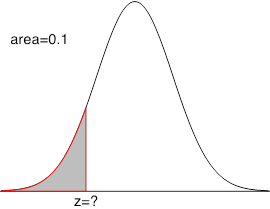
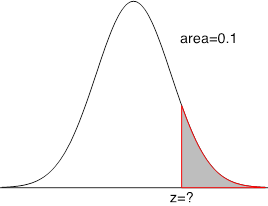
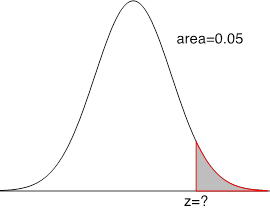
Find the [latex]z[/latex]-score corresponding to the shaded area in each graph:
 |
 |
 |
| Closest value to [latex]0.1[/latex] is [latex]0.1003 \Longrightarrow z= -1.28.[/latex] | Method 1: Area on the right is [latex]0.1 \Longrightarrow[/latex] area on the left is [latex]0.9[/latex], the closest value is[latex]0.8997 \Longrightarrow z= 1.28.[/latex] Method 2: due to symmetry, [latex]z=1.28.[/latex] |
Area on the right is [latex]0.05 \Longrightarrow[/latex] area on the left is [latex]0.95[/latex], two values [latex]0.9495 (z=1.64)[/latex] and [latex]0.9505 (z=1.65)[/latex] are equally close to 0.95 [latex]\Longrightarrow z = \frac{1.64 + 1.65}{2} = 1.645.[/latex] |
The notation [latex]z_{\alpha}[/latex] (read as z alpha) has a special meaning: the z-score that has an area of [latex]\alpha[/latex] to its right under the standard normal curve. The middle and right panels of the example above show that [latex]z_{0.1}=1.28[/latex] and [latex]z_{0.05}=1.645[/latex].
Exercise: Finding Z-score [latex]\color{white}Z_{\alpha}[/latex]
Use the standard normal table to find
- [latex]Z_{0.25}[/latex]: z-score with an area of 0.25 to its right
- [latex]Z_{0.6}[/latex]: z-score with an area of 0.6 to its right
- [latex]Z_{0.005}[/latex]: z-score with an area of 0.005 to its right
Show/Hide Answer
- [latex]Z_{0.25}[/latex]: z-score with an area of 0.25 to its right, so the area to the left of [latex]Z_{0.25}[/latex] is 1-0.25=0.75. Search the main body of the table; the closest value to 0.75 is 0.7486, which corresponds to the z-score 0.67; therefore, [latex]Z_{0.25}=0.67[/latex].
- [latex]Z_{0.6}[/latex]: z-score with an area of 0.6 to its right, so the area to the left of [latex]Z_{0.6}[/latex] is 1-0.6=0.4. Search the main body of the table; the closest value to 0.4 is 0.4013, which corresponds to the z-score -0.25; therefore, [latex]Z_{0.6}=-0.25[/latex].
- [latex]Z_{0.005}[/latex]: z-score with an area of 0.005 to its right, so the area to the left of [latex]Z_{0.005}[/latex] is 1-0.005=0.995. Search the main body of the table for 0.995. Two values that are equally close to 0.995 are 0.9949 and 0.9951; the corresponding z-scores are 2.57 and 2.58, respectively. Therefore, [latex]Z_{0.005}=\frac{2.57+2.58}{2}=2.575[/latex].
