1.7 Review Questions
- In order to study the effect of aspirin on preventing heart disease and stroke for women over 50 years old, 30,000 initially healthy women 50 years of age or older in Canada were randomly selected. These 30,000 women were randomly assigned to either receive 100 mg of aspirin or placebo (vitamin) on alternative days and were monitored for 10 years. The results showed that the percentage of heart disease and stroke is significantly lower in the aspirin group than in the placebo group. Therefore, we claim that aspirin is effective in preventing heart disease and stroke for all women over 50 years old in Canada.
- Identify the population and sample in this study.
- Is this study inferential or descriptive?
- Is this an observational study or a design experiment?
- The following table gives the salaries (in thousand dollars) for physics and computer science (CS) majors obtaining a bachelor’s degree, a master’s degree or a PhD.
SALARY MAJOR DEGREE 51.9 Physics Bach 58.2 Physics Bach 49.9 Physics Bach 50.6 Physics Bach 51.4 Physics Bach 43.7 Physics Bach 52.9 Physics Bach 59.2 Physics Master 60.5 Physics Master 57.1 Physics Master 59.1 Physics Master 54.9 Physics Master 61.7 Physics Master 62.4 Physics Master 78.2 Physics PhD 69.6 Physics PhD 70.5 Physics PhD 73.2 Physics PhD 81.7 Physics PhD 74.8 Physics PhD 69.8 Physics PhD SALARY MAJOR DEGREE 50.8 CS Bach 59.4 CS Bach 55.9 CS Bach 45.1 CS Bach 54.1 CS Bach 50.7 CS Bach 46.8 CS Bach 65.8 CS Master 57.5 CS Master 66.9 CS Master 62.8 CS Master 68.5 CS Master 69.3 CS Master 61.5 CS Master 73.3 CS PhD 65.7 CS PhD 71.7 CS PhD 72.5 CS PhD 73.0 CS PhD 67.2 CS PhD 67.5 CS PhD - Use the most proper graphs to summarize each of the three variables “salary”, ”major” and ”degree”.
- Describe the shape of the histogram of salary.
Show/Hide Answer
-
- The population is all women over 50 years old in Canada. The sample is those 30,000 women.
- This is an inferential study since it generalized the conclusion to the entire population–all women over 50 years old in Canada.
- This is a designed experiment, since the subjects were randomly assigned to the two different groups.
-
- The variable “salary” is a quantitative continuous variable, we can use histogram, boxplot or stem-and-leaf diagram to summarize it. Both “major” and “degree” are qualitative variables, we can use either a pie chart or a bar chart to summarize them.
- It is bimodal. It is hard to tell whether it is symmetric or skewed. We might be able to tell the shape better if we draw a boxplot as well.
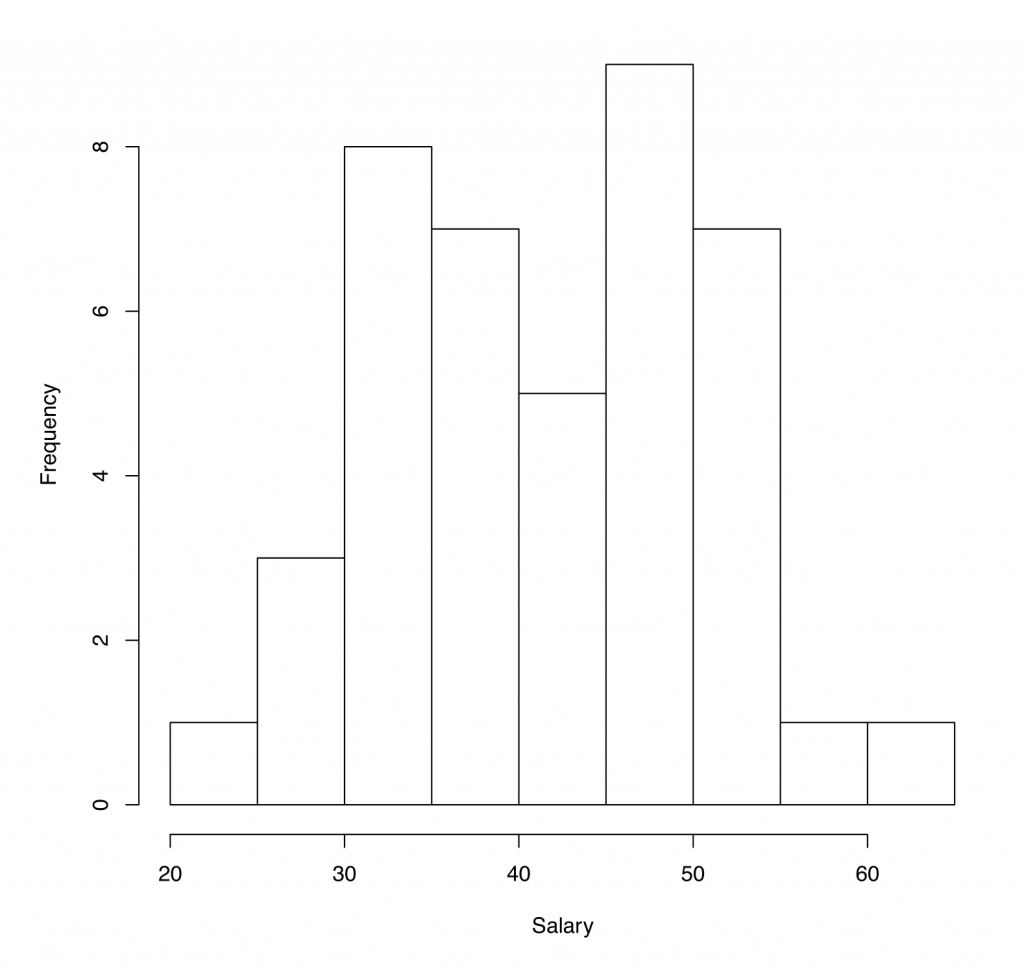
Figure 1.10 [Image Description (See Appendix D Figure 1.10)]
