12.3 F Distribution
In a two-sample [latex]t[/latex] test, we use the [latex]t[/latex] distribution to calculate the P-value and find the critical value. ANOVA relies on the F distribution whose density curve is unimodal, right skewed, and has two degrees of freedom. The ratio of MSTR over MSE follows an F distribution with degrees of freedom [latex]df_n = k-1[/latex] and [latex]df_d = n-k[/latex].
The figure below shows the density curve of several F distributions with different degrees of freedom.
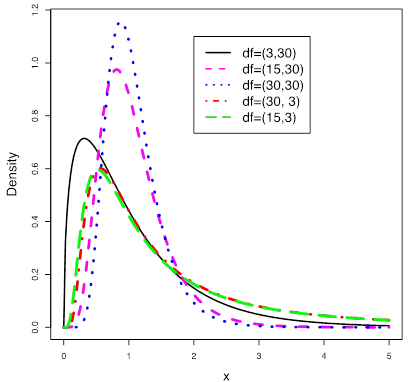
The properties of F-density curves are as follows:
Key Fact: Properties of F Density Curve
- Total area under the curve=1.
- The entire curve is above the horizontal axis.
- Right skewed.
- Horizontal axis spans from 0 to [latex]+ \infty[/latex]
- The two degrees of freedom [latex]df_n[/latex] and [latex]df_d[/latex] control the overall shape.
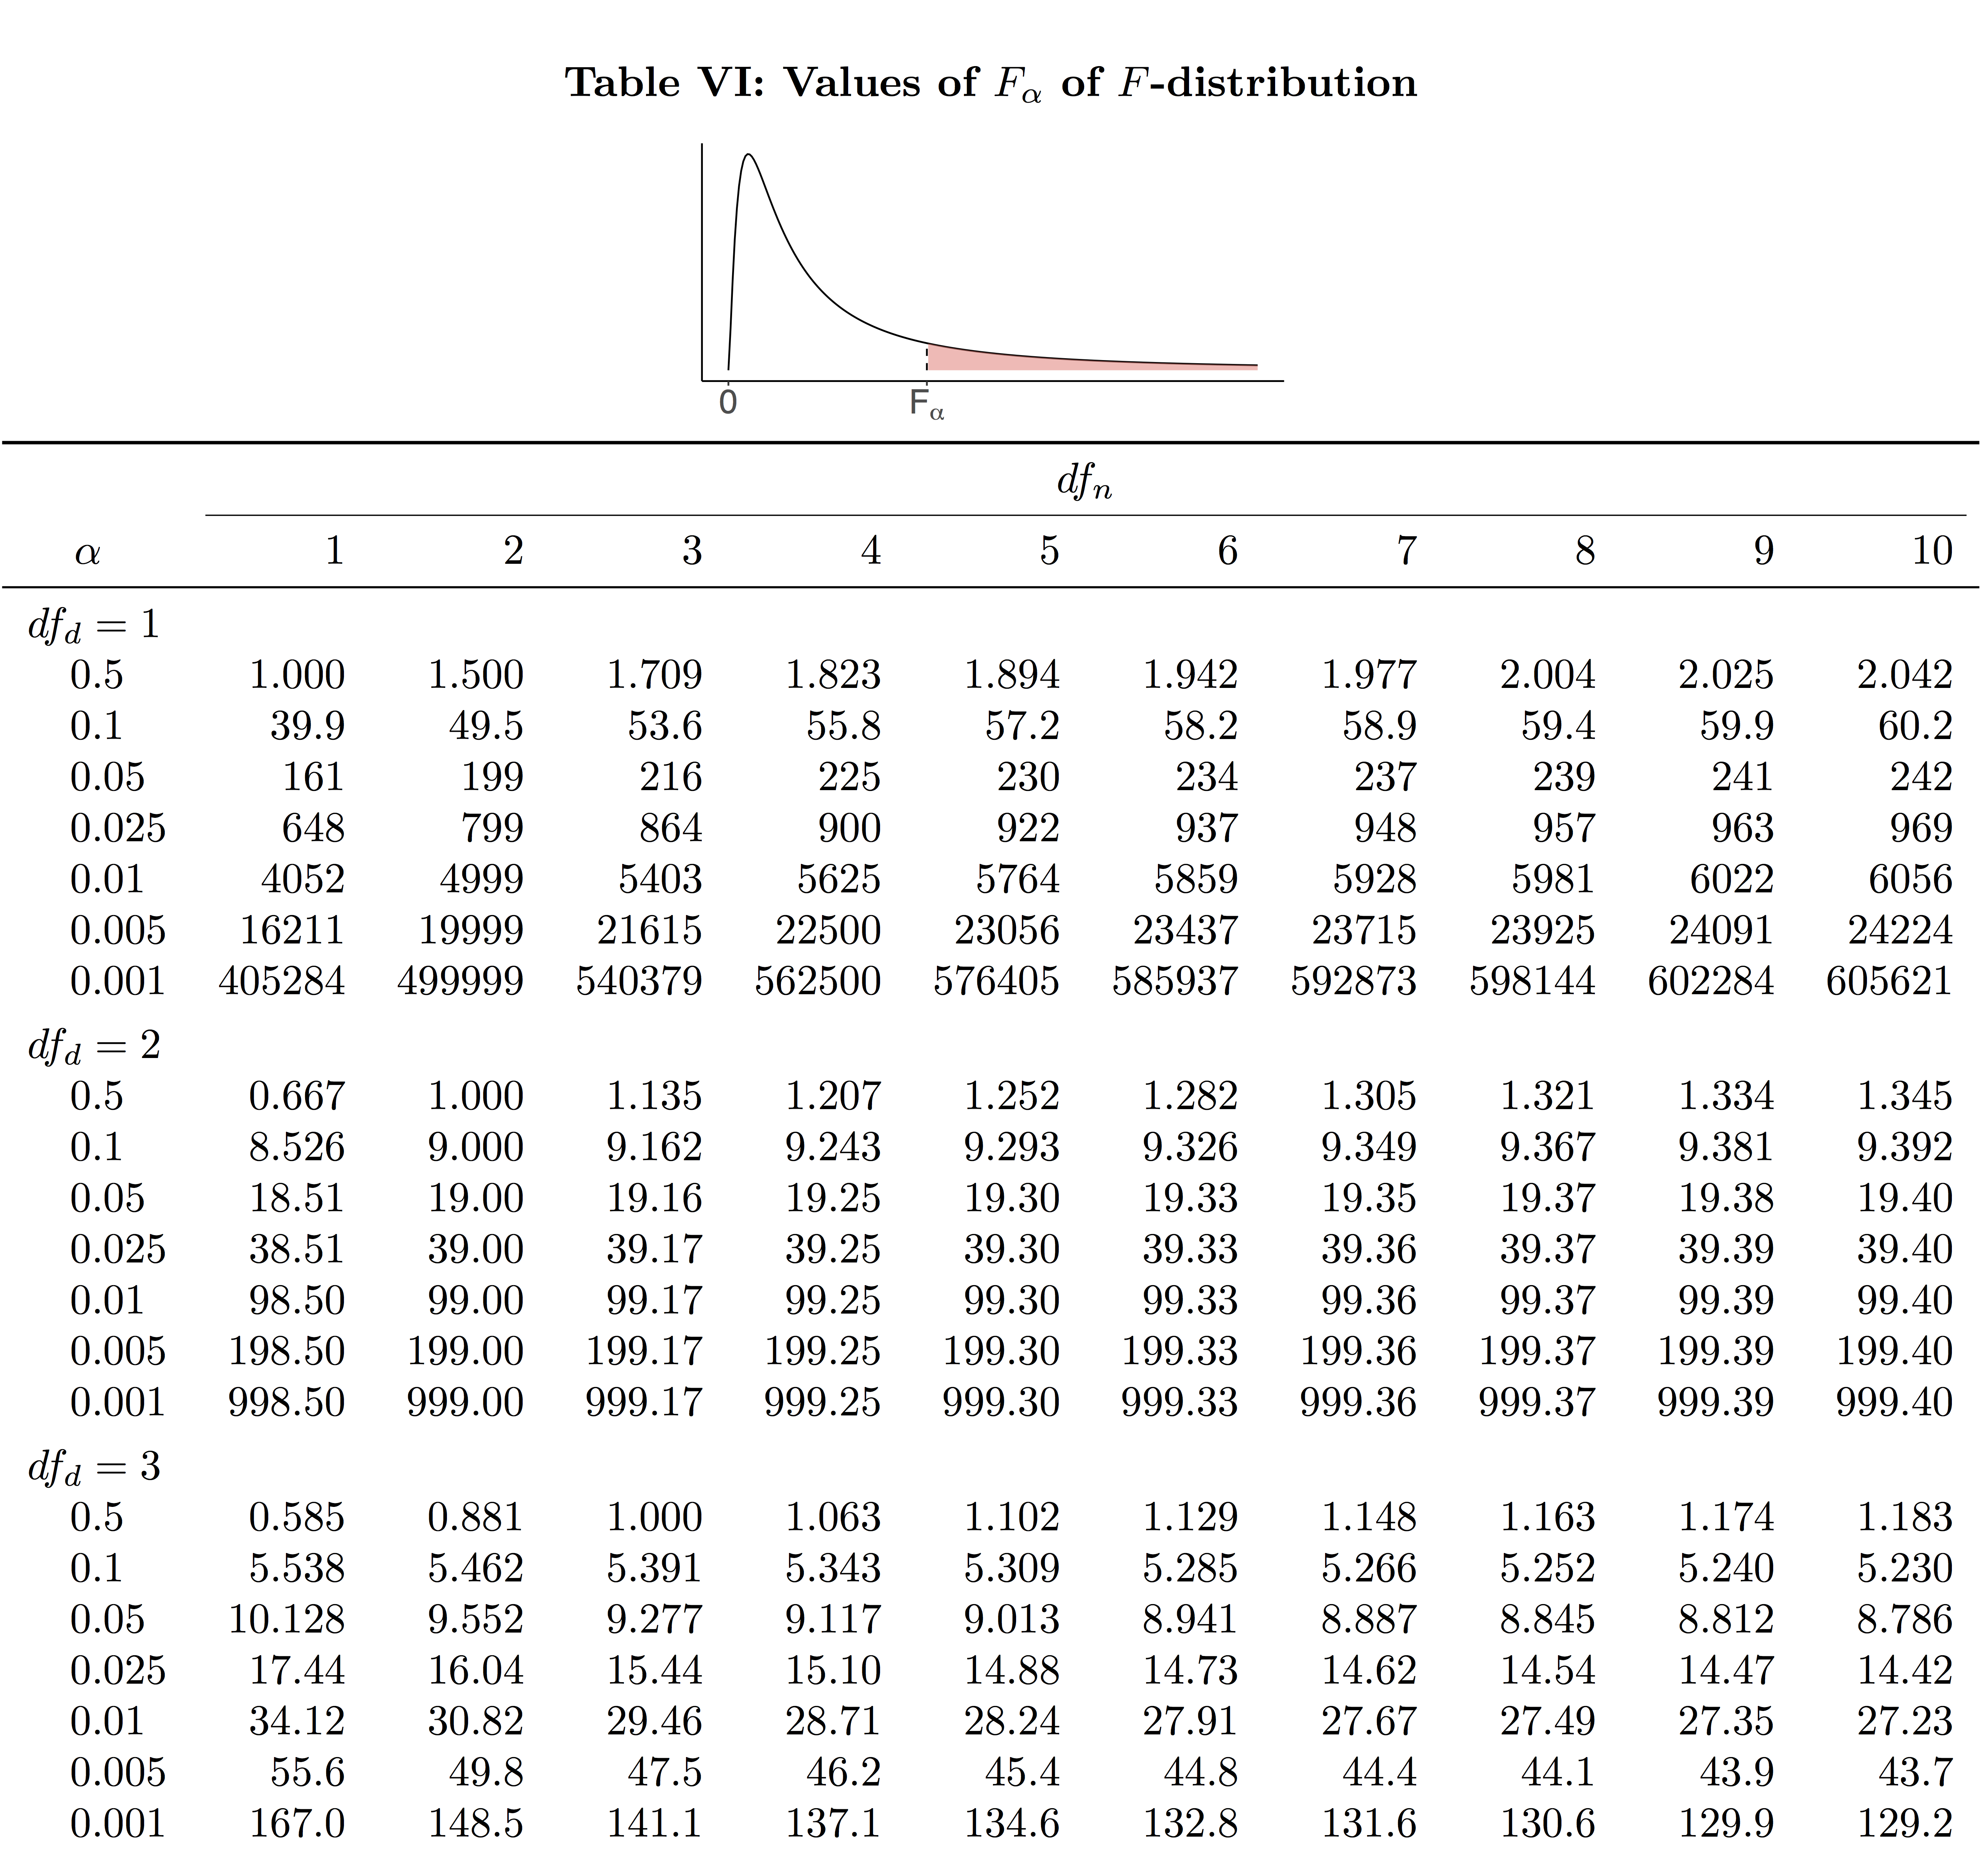
Similar to the [latex]t[/latex] score table (Table IV), the F Table (see Table VI below) gives scores that correspond to right-tailed probabilities. For given numerator degrees of freedom [latex](df_n)[/latex] and denominator degrees of freedom [latex](df_d)[/latex], the F-score [latex]F_{\alpha}[/latex] is the value with an area [latex]\alpha[/latex] to its right. For example, for [latex]df_n =2 , df_d = 3, F_{0.1}=5.462, F_{0.01}=30.82[/latex], and [latex]F_{0.005}=49.8[/latex].
Table 12.3: Part of the F Table (Table VI)