1.2 Data Collection
Most decision-making is based on facts and evidence, and data collection is an excellent means of obtaining evidence. For example,
- If you wanted to determine whether three cars provide sufficient capacity for the LRT train running between the Health Sciences and MacEwan stations, you could stand at the entrance of the MacEwan Station and count the number of people entering and exiting the station during peak hours on a regular school day. The data would help to determine whether more or less cars are needed.
Another example is in medical science.
- If you want to confirm whether a new drug is more effective than the old one, you would need to obtain a sample of patients with a similar condition and randomly assign them to two groups: subjects in one group receive the new drug, and subjects in the other group receive the old drug. After each drug has taken effect, you would compare the outcomes of the two groups.
Common ways to collect data are sampling surveys, observational studies, and designed experiments. For sampling methods, students in this course are only required to understand simple random sampling, which will be introduced in the next section. The main difference between an observational study and a designed experiment is that a designed experiment involves manipulations of the subjects, while an observational study does not.
1.2.1 Sampling Methods
In statistics, a sampling survey describes the process of selecting a sample of individuals/items from a target population in order to conduct a survey. A census is a type of survey in which the researcher samples the entire population. Typically, a census requires a population which is reasonably small, otherwise the process of data collection can be expensive, time-consuming and, in some cases, impossible. In fact, it is usually the case that the population is too large for the researcher to survey all of its members. For this reason, it is often the case that a small, carefully chosen sample is used to represent the population.
The logic behind sampling is this: by well-mixing the population, we are able to learn about the entire population by examining a sample. For example, suppose you are cooking a pot of soup and you would like to taste the soup; you do not need to have the whole pot—you just need to taste or sample a spoon of it. How can we "stir" people or items in sampling? We adopt the idea of randomization, which means we select individuals or items randomly.
Simple Random Sampling
Sampling methods are classified as either probability or nonprobability. In probability samples, each member of the population has a known, non-zero probability of being selected. In Stat 151, we only cover one particular sampling procedure, i.e., simple random sampling, in which each possible sample of a given size has equal chance of being selected. In simple random sampling, each individual is equally likely to be selected. For example, picking four cards randomly after shuffling the cards well, each card has the same chance of being picked. A sample obtained by simple random sampling is called a simple random sample (SRS).
There are two types of simple random sampling. One is simple random sampling with replacement, whereby individuals of the population can be selected more than once; the other is simple random sampling without replacement, whereby any individuals of the population can be selected at most once.
There are several ways to obtain a simple random sample:
- Picking slips of paper out of a box
- Generating by computer
- Using a random numbers table
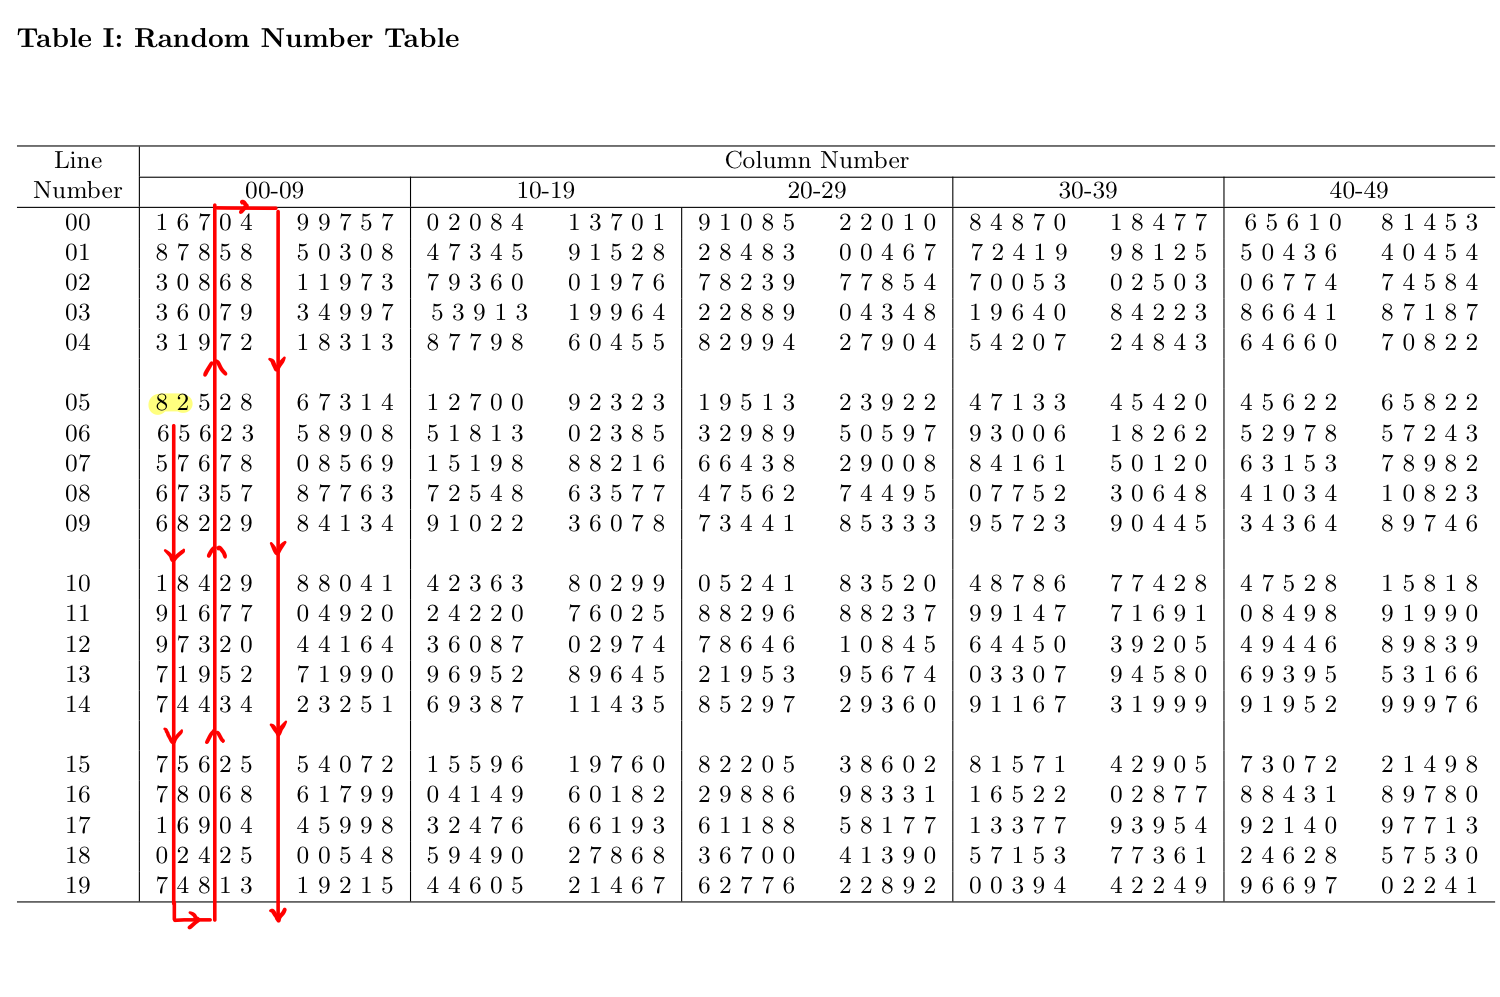
Obtaining a simple random sample by picking slips of paper out of a box is impractical, especially when the population is large. We can either use a computer or the random-number tables (see one below) to generate a simple random sample. The arrows are used to show our example that follows.
Example: Simple Random Sampling Using the Random Number Table
Let us use the table above to show how to obtain a simple random sample without replacement.
Suppose our section consists of 60 students, from which we would like to obtain a random sample of size 10. First, we can number the students from 1 to 60. To select 10 random numbers between 1 and 60, we first pick a random starting point. We can close our eyes and randomly point our finger into the table and use the first two digits of the number we point on as the starting point. For example, if the number you pick is 82 (Line number 05 and column number 00-01), then go down the column, the second number is 65 which is greater than 60 and hence is discarded, the third one is 57 which is good to keep, the next one is 67 which is greater than 60 and hence is discarded, the next ones are 68 (discarded), 18 (good to keep), 91 (discarded), 97 (discarded), 71 (discarded), 74 (discarded), 75 (discarded), 78 (discarded), 16 (good to keep), 02 (good to keep), 74 (discarded). Now we are at the end of columns 00-01, move to columns 02-03 at the bottom then move up, the numbers are 81 (discarded), 42 (keep), 90 (discarded), 06 (keep), 62 (discarded), 43 (keep), 95 (discarded), 32 (keep), 67 (discarded), 42 (already in the list, discarded), 22( keep), 35 (keep). As a result, the 10 random numbers are: 57, 18, 16, 02, 42, 06, 43, 32, 22, 35.
In this course, a simple random sample means a simple random sample without replacement by default.
In practice, the most popular way to obtain a simple random sample is using computer.
Example: Simple Random Sampling Using R Commander
Suppose our section consists of 60 students, use R Commander to generate a simple random sample of size [latex]n=10[/latex] without replacement. In order to obtain the same sample, use "4061" as the random seed.
Similar to picking a random starting point, we first need to set a random seed using the function "set.seed()". A simple random sample can be obtained using R Commander in two steps:
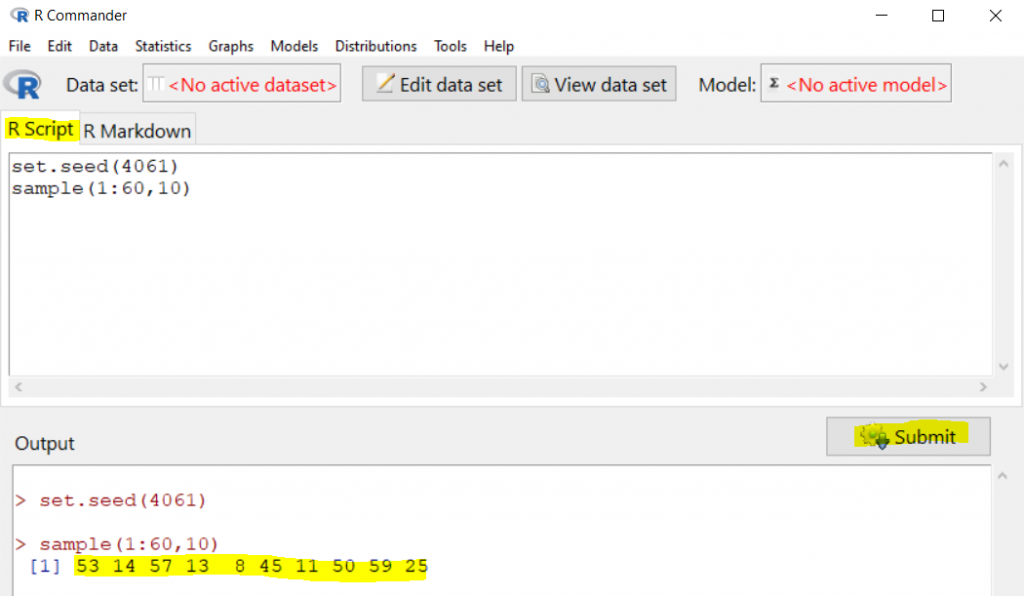
- Type "set.seed(4061)" in the R Script window, then press "Submit". By doing this, we will obtain the same sample if we rerun the command line.
- Type "sample(1:60, 10)" in the R Script window, and then press "Submit". The function "sample()" is used to generate a simple random sample. The first input argument indicates from what the sample is taken from. In this example, it is "1:60" which means [latex]1, 2, 3, \cdots, 59, 60[/latex]. The second input argument specifies the sample size. The command line "sample(1:60, 10)" means we could like to randomly take 10 different numbers between 1 and 60.
The resulting sample is 53, 14, 57, 13, 8, 45, 11, 50, 59, 25 (see the snapshot below).

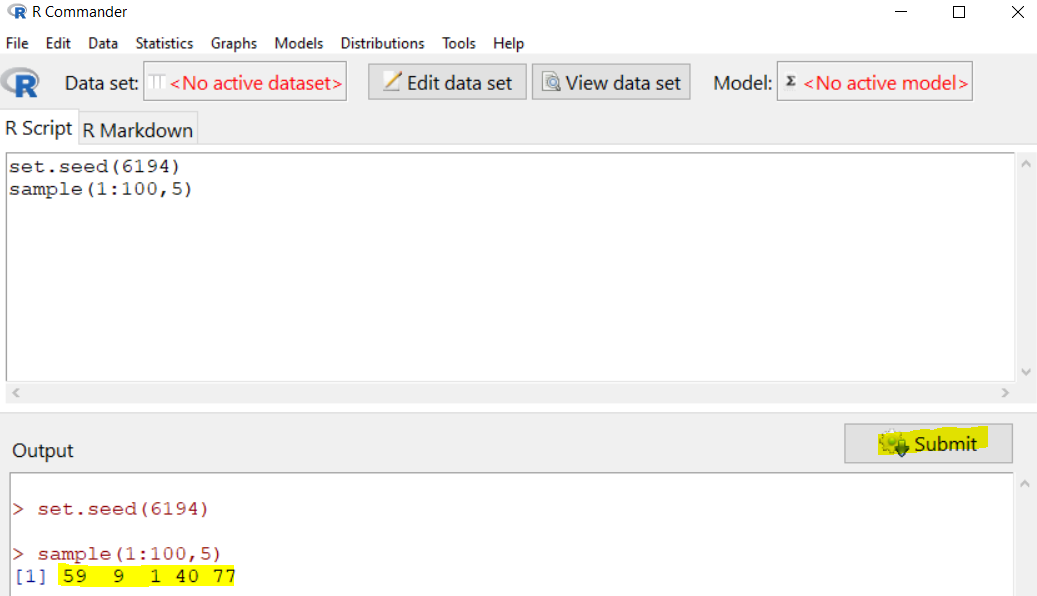
Suppose that a class consists of 100 students, use R Commander to generate a simple random sample of size [latex]n=5[/latex] without replacement. Use "6194" as the random seed.
Use R Commander to generate a simple random sample of size [latex]n=5[/latex] without replacement. Use "6194" as the random seed.
Show/Hide Answer
- Type "set.seed(6194)" in the R Script window, then press "Submit".
- Type "sample(1:100, 5)" in the R Script window, and then press "Submit".
The resulting sample is 59, 9, 1, 40, 77.
Some Other Sampling Methods (not required, extra reading)
Besides the simple random sampling, some other good sampling methods include:
- Stratified sampling: Population is divided into homogeneous groups called strata and then simple random sampling is applied within each stratum. For example, 65% of students at MacEwan are female students. A stratified sample of 100 students can be obtained by drawing a simple random sample of 65 female students and a simple random sample of 35 male students.
- Cluster sampling: Split the population into clusters and select one or several clusters at random. And then conduct a census within each cluster. Each cluster should represent the full population fairly. For example, Edmonton is geographically divided into 375 neighborhoods. A cluster sample residents of Edmonton can be obtained by taking a simple random sample of 20 neighborhoods and then taking all residents in those 20 selected neighborhoods.
- Systematic sampling: Select every kth individual from the sampling frame, e.g., choose every 5th person on an alphabetical list of students. If we start from the 4th individual, and we choose every 5th person, the resulting list will be [latex]4, 4+5=9, 9+5=14, 14+5=19[/latex], and etc. Therefore the 4th, 9th, 14th, 19th, and so on on the list will be in the sample.
Some convenient but relatively not that desirable sample methods are:
- Voluntary response sampling: A large group of individuals is invited to respond and all who do respond are counted, e.g., online survey.
- Convenience sampling: This includes individuals who are convenient to sample. For example, stop people in a mall and ask questions.
If I want to know the percentage of residents in Edmonton who have taken at least one statistics course like STAT 151, identify and explain the advantages and disadvantages of the following sampling methods.
- Stop 100 people at the entrance of MacEwan and ask for their response.
- Get the phone numbers of all residents in Edmonton from the census data, randomly pick 100 people, call them and ask for their response.
- Send invitations to fill out an online survey.
Show/Hide Answer
- This is a convenience sample. Advantage is convenient to take the sample. Disadvantage is the estimate is biased and might overestimate the percentage.
- This is a simple random sample. However, we will miss those whose phone numbers are not listed and those who do not answer the phone.
- This is a voluntary sample. It is cost effective to send invitations. However, the response rate might be low and we will miss those who have no access to computer.
Note: In practice, there might be no sampling method that will correspond exactly to simple random sampling; but some will be better than others.
1.2.2 Designed Experiments
Design experiments are another method of data collection. In a designed experiment, investigators randomly assign subjects to different experimental groups (called treatments), observe the outcomes, and test whether treatment differences are statistically significant. A designed experiment is ideal for investigating a cause-effect relationship.
Example: A Designed Experiment
Researchers in a pharmaceutical company want to test whether their new pain killer is effective or not in reducing pain. Forty females with similar conditions (e.g., age, diet) are randomly assigned to two groups: 20 take a vitamin and another 20 take the pain killer. The subjects are then asked to report their pain score in a scale of 0 to 10, four hours after taking the pill. Here is how the experiment is designed:
- The 40 female participants should be in similar conditions to minimize the effect of other factors, such as age, diet, and etc.
- It is also important to ensure that the vitamin and the pain killer look similar, so that participants do not know which group they are in. Here, the vitamin is called the placebo. It is well-known that people tend to feel better after they receive some kind of treatment, even if the treatment does not have any physical effect; this is called the placebo effect. By having both a treatment group and a placebo group, the researchers are able to minimize the placebo effect and hence more accurately measure the effectiveness of the pain killer.
- Randomly assign the individuals to the two different groups by collecting a simple random sample of 20 out of the 40 individuals, assigning them to the vitamin (placebo) group, and assigning the remaining 20 individuals to the group receiving the pain killer.
1.2.3 Observational Studies
In some studies, it may not be possible to randomly assign the subjects to different treatment groups due to ethical or practical reasons. For example, we cannot randomly assign people into smoker and non-smoker groups. In those cases, we might have to conduct observational studies.
In an observational study, the investigator observes the characteristics of individuals in samples from a population of interest to discover trends and possible relationships between variables.
In order to study the association between breast cancer and smoking, can we randomly assign the participants to the smoker or non-smoker group? Which of the following two studies do you think better?
- Follow 20 smokers and 20 non-smokers who have similar conditions, compare the occurrences of breast cancer in the two groups at the end of study.
- From one hospital, sample 20 breast cancer patients and another 20 patients without breast cancer by matching, i.e., we try to make the two groups as similar as possible except for the cancer status. Determine the smoking status for each subject and compare the percentages of smokers in both groups. This is called a case-control study. A breast cancer patient is a case, while a patient without breast cancer is a control.
Show/Hide Answer
The second study plan is better. Not everyone will develop breast cancer at the end of the first study; we might not observe any cases of cancer in either groups. The first study plan could potentially end up with no useful results. In the second study, however, we are always able to compare the percentage of smokers between groups and therefore, establish the association between smoking and breast cancer.

- For rare disease, it is better to first recruit participants with the condition (called cases) and then recruit participants without the condition (controls) by matching other characteristics.
- It is easier to establish a causal relationship with experimental studies than observational studies. Whenever possible, experimental studies are preferred.
