3.2 Probability of An Event
Given an event [latex]E[/latex], the chance or the probability that the event [latex]E[/latex] happens is denoted as [latex]P(E)[/latex]. A probability near 0 indicates that the event is very unlikely to occur when the chance experiment is conducted, whereas a probability near 1 suggests that the event is very likely to occur.
3.2.1 Frequentist Interpretation of Probability
From the frequentist’s point of view, the probability of an event can be interpreted as the proportion of times the event occurs in a large number of repetitions of the chance experiment. For instance, if we flip a balanced coin 100 times and observe 55 heads, then the probability of observing a head is
[latex]P(H) \approx \frac{\text{\# of times we observe a head}}{n} = \frac{55}{100} = 0.55.[/latex]
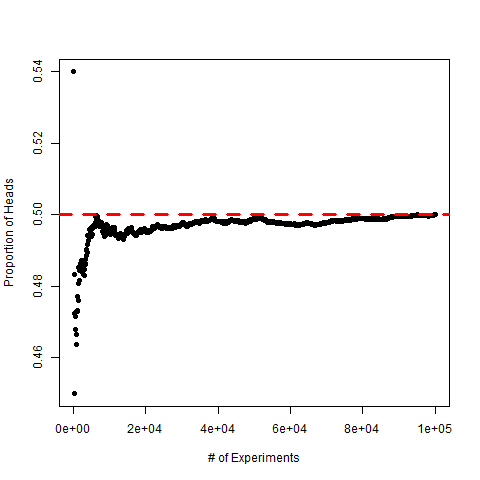
The figure below shows that the proportion approaches to 0.5 as the number of experiments repetitions [latex]n[/latex] increases. It is expected to observe heads half of the time, because the coin is balanced and there is a 50–50 chance heads are observed. Therefore, the proportion of observed heads will approach a constant when the coin is flipped infinite times, this constant is [latex]P(H).[/latex]
Theoretically speaking, it is impossible to observe the probability of an event [latex]P(E)[/latex], because we won’t repeat the chance experiment infinite times. However, we can sometimes calculate the probability based on a model or some probability rules.
3.2.2 Equally Likely Outcome Model, the f/N Rule
The simplest model, the equally likely outcome model, assumes that all possible outcomes have equal chance to be observed, such as flipping a balanced coin and rolling a fair die. For the equally likely outcome model, the probability that an event E happens is given by
[latex]\begin{align*} P(E) &= \frac{\text{\# of sample points in event }E}{\text{\# of sample points in sample space }S} \\ &= \frac{\text{\# of ways event E can occur}}{\text{\# of possible outcomes}} \\ &= \frac{f}{N}. \end{align*}[/latex]
Example: Equally Likely Outcomes
- Recall that a standard die has sample space [latex]S[/latex]= {1, 2, 3, 4, 5, 6}. Use the equally likely outcomes model to find the probability of the following events:
- Observing a six: E = {6}
[latex]P(E) = \frac{\text{\# of sample points in event E}}{\text{\# of sample in sample space S}} = \frac{f}{N} = \frac{1}{6}.[/latex]
- Observing an even number: A = {2, 4, 6}
[latex]P(A) = \frac{\text{\# of sample points in event A}}{\text{\# of sample points in space S}} = \frac{f}{N} = \frac{3}{6}=\frac{1}{2}.[/latex]
- Observing an outcome that is less than 3: B = {1, 2}
[latex]P(B) = \frac{\text{\# of sample points in event B}}{\text{\# of sample points in space S}} = \frac{f}{N} = \frac{2}{6} = \frac{2}{3}.[/latex]
- Suppose there are 100 students in a class, the following table summarizes the frequencies of number of siblings the students have:
Table 3.2: Frequency and Relative Frequency of # of Siblings
| Total | 100 | 1.00 |
| # of Siblings | Frequency | Relative Frequency |
| 0 | 10 | 0.10 |
| 1 | 30 | 0.30 |
| 2 | 35 | 0.35 |
| 3 | 15 | 0.15 |
| >3 | 10 | 0.10 |
Find the probability that a randomly selected student has:
- exactly one sibling
If we randomly pick one student, each student has the same chance to be chosen; therefore, we can use the equally likely outcome model. There are [latex] f=30[/latex] students with exactly one sibling. Hence
[latex]P(E) = \frac{\text{\# of sample points in event E}}{\text{\# of sample points in sample space S}} = \frac{f}{N} = \frac{30}{100} = 0.3.[/latex]
- at least one sibling, which means one, two, three, or more than three siblings.
[latex]P(E) = \frac{\text{\# of sample points in event E}}{\text{\# of sample points in sample space S}} = \frac{f}{N} = \frac{30+35+15+10}{100} = 0.9.[/latex]
- two to three siblings (inclusive), which means either two or three siblings.
[latex]P(E) = \frac{\text{\# of sample points in event E}}{\text{\# of sample points in sample space S}} = \frac{f}{N} = \frac{35+15}{100} = 0.5.[/latex]
Key Facts: Basic Properties of the Probability of an Event
- The probability of an event P(E) is always between 0 and 1, that is, [latex]0 \leq P(E) \leq 1[/latex].
- The probability of an event that can never occur is 0, e.g., P (observe a 7 when roll a regular die) = 0.
- The probability of an event that must occur is 1, e.g., P (observe a number smaller than 7 when roll a regular die) = 1.
All these properties can be easily shown by the f/N rule.
It is straightforward to show that using the f/N rule:
- [latex]P(\varnothing) = 0[/latex], where [latex]\varnothing[/latex] is the empty set, a set with no element.
- [latex]P(S) = 1[/latex]
