11.2 Chi-Square Distribution
Just as z-tests are based on the normal distribution and t-tests are based on the t-distribution, chi-square tests are based on the chi-square distribution.
Key Facts: Chi-Square Distribution
- If [latex]Z \sim N(0, 1)[/latex], then [latex]Z^2 \sim \chi^2[/latex] distribution with degrees of freedom [latex]df=1[/latex].
- If [latex]Z_1, Z_2, \dots, Z_n[/latex] are independent and follow a standard normal distribution [latex]N(0, 1)[/latex], then [latex]Z_1^2 + Z_2^2 + \dots + Z_n^2 \sim \chi^2[/latex] distribution with [latex]df = 1 + 1 + \dots + 1 = n[/latex].
- If [latex]W \sim \chi^2[/latex] with [latex]df = p[/latex], [latex]V \sim \chi^2[/latex] with [latex]df = q[/latex] and they are independent, then [latex]W + V \sim \chi^2[/latex] with [latex]df = p + q[/latex].
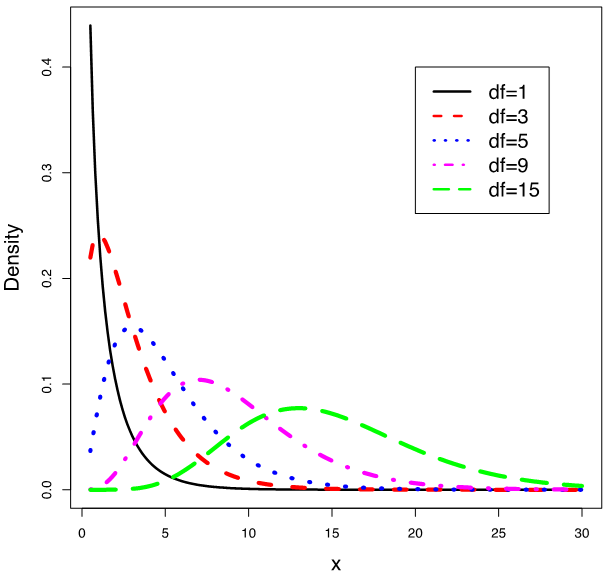
Like the t distribution, the chi-square distribution is determined by one parameter, the degrees of freedom. The figure below shows the density curves of chi-square distributions with [latex]df = 1, 3, 5, 9, 15[/latex].

The properties of the chi-square density curve are as follows:
Key Facts: Properties of Chi-Square Density Curve
- The total area under the curve is 1.
- It is right skewed.
- As the degrees of freedom increase, the chi-square curves appear more symmetric.
- Every chi-square random variable is non-negative with possible values between 0 and [latex]\infty[/latex].
- The mean of a chi-square is equal to its degrees of freedom and the standard deviation is the square root of twice the degrees of freedom. Suppose the degrees of freedom of a chi-square distribution is [latex]\gamma[/latex], then [latex]\mu=\gamma, \sigma=\sqrt{2\gamma}[/latex].
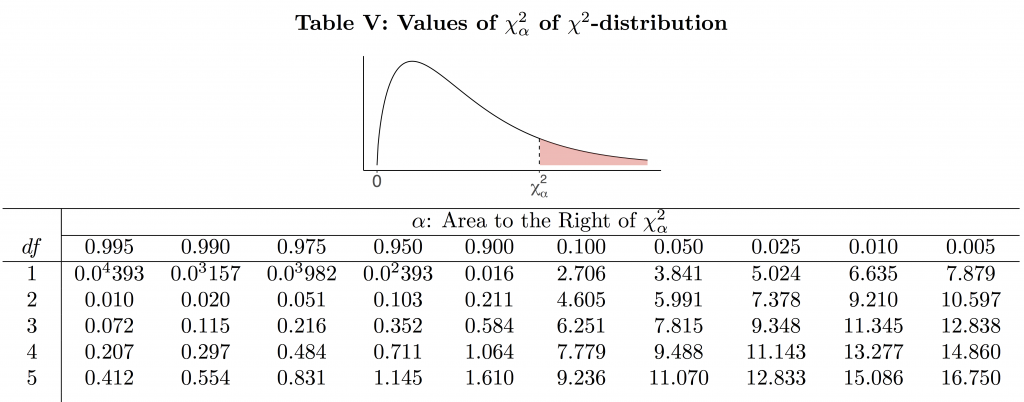
Like the t score table, the [latex]\chi^2[/latex] table (Table V) gives critical values [latex]\chi_{\alpha}^2[/latex]. Each critical value [latex]\chi_{\alpha}^2[/latex] has an area of [latex]\alpha[/latex] to its right under the curve of the chi-square distribution with a certain degrees of freedom df.
Table 11.1: Part of Chi-Square Table (Table V)


