8.3 Main Idea Behind Hypothesis Tests for μ
The main idea of a hypothesis test is to use the data as evidence to disprove the null [latex]H_0[/latex] and thus prove that the alternative [latex]H_a[/latex] is true. The idea behind a hypothesis test for the population mean is as follows:
Collect from the population a simple random sample: [latex]x_1, x_2, \dots, x_n[/latex] and calculate the sample mean [latex]\bar{x} = \frac{x_1 + x_2 + \dots + x_n}{n}[/latex]. Our “evidence” stems from the discrepancy between the point estimate [latex]\bar{x}[/latex] and the hypothesized population mean [latex]\mu_0[/latex].
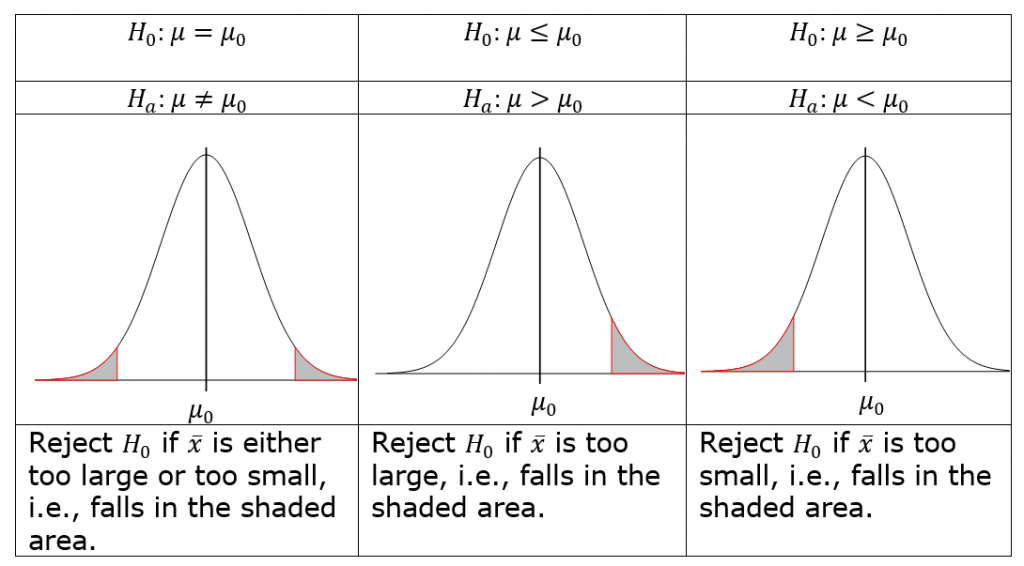
Reject the null hypothesis [latex]H_0[/latex] if the sample mean [latex]\bar{x}[/latex] does not support the null [latex]H_0[/latex]. That is, we should reject [latex]H_0[/latex] if [latex]\bar{x}[/latex] is too extreme. The word “extreme” means contradicting the null [latex]H_0[/latex] in favour of the alternative [latex]H_a[/latex].
In order to quantify how the data (our evidence) contradict the null hypothesis, we first assume the null hypothesis [latex]H_0[/latex] is true and calculate the chance of observing a sample mean at least as extreme as the observed [latex]\bar{x}[/latex]. Reject the null [latex]H_0[/latex] if the chance is small; otherwise, fail to reject [latex]H_0[/latex]. Recall that for a normal population or a large sample size, the sample mean [latex]\bar{X} \sim N \left( \mu, \frac{\sigma}{\sqrt{n}} \right) \Longrightarrow Z = \frac{\bar{X} - \mu}{\sigma / \sqrt{n}} \sim N(0,1)[/latex] and [latex]t = \frac{\bar{X - \mu}}{s / \sqrt{n}} \sim t[/latex] distribution with [latex]df = n-1.[/latex] We call the variables [latex]Z = \frac{\bar{X} - \mu}{\sigma / \sqrt{n}}[/latex] or [latex]t = \frac{\bar{X - \mu}}{s / \sqrt{n}}[/latex] the test statistics. We should reject the null hypothesis [latex]H_0[/latex] if the observed test statistic [latex]z_o = \frac{\bar{x} - \mu_0}{\sigma / \sqrt{n}}[/latex] or [latex]t = \frac{\bar{x} - \mu_0}{s / \sqrt{n}}[/latex] is too extreme.
